reyemsaibot

SAP BI Blog about SAP BW/4HANA, Analysis for Office and SAP HANA - by Tobias Meyer

Schlagwort: sac

  • Data Warehouse Cloud Analytic Model is available

    Update 01/2025

    Name change from SAP Data Warehouse Cloud to SAP Datasphere. Some links may break.

    The Datasphere Analytic Model is now on all tenants available. With this wave, you have now the possibility to use instead of an Analytical Dataset (ADS) the new Analytic Model. The Analytic
    Model is a kind of cube which allows you to slice and dice your data model. I wrote about the preview access on December,
    and now I want to show you some details.

    Datasphere: Analytic Model
    Datasphere: Analytic Model

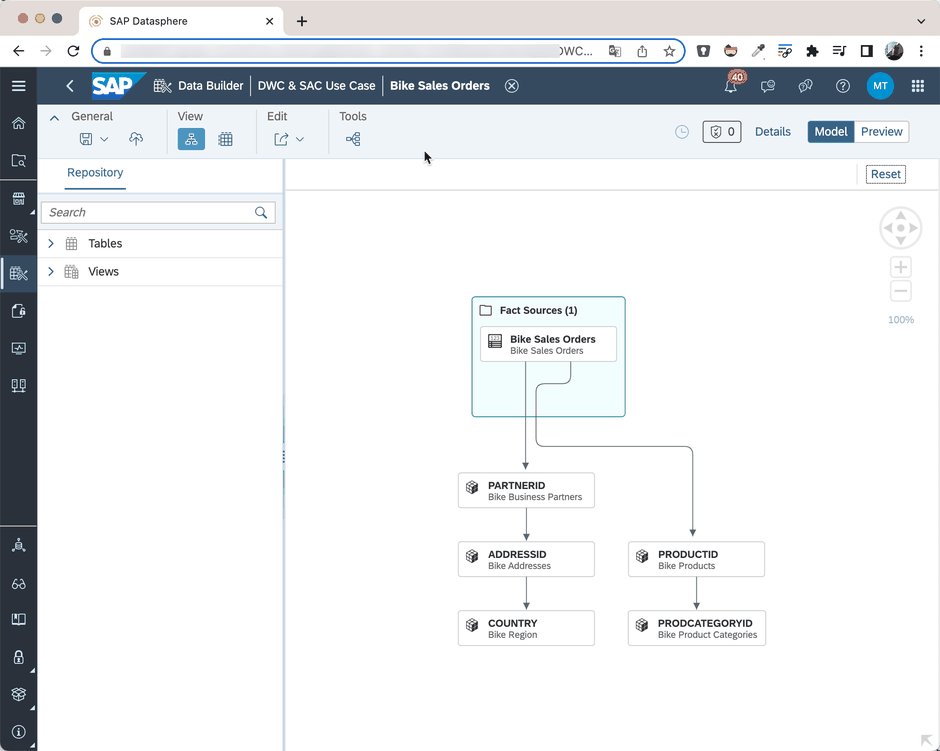
    The Analytic Model is the new place to go as a model for the SAP Analytics Cloud (SAC). It allows adding several dimensions and build a nested view of your data. As you see in the screenshot
    above, you have now the possibility to make slice and dice like in Analysis for Office. You can easily drag and drop the dimensions to the columns/rows and build the view of the data you need.
    Datasphere: Analytic Model Preview
    Datasphere: Analytic Model Preview

    As you see in the screenshot, the Bike Sales Orders fact model has two dimensions, the Partner ID and the Product ID. But I have now the possibility to go further down. For example, from the
    Partner ID to the Address ID and then to the Country dimension. So I have texts or hierarchies available which are build on the country dimension. This is how it looks like in the preview.
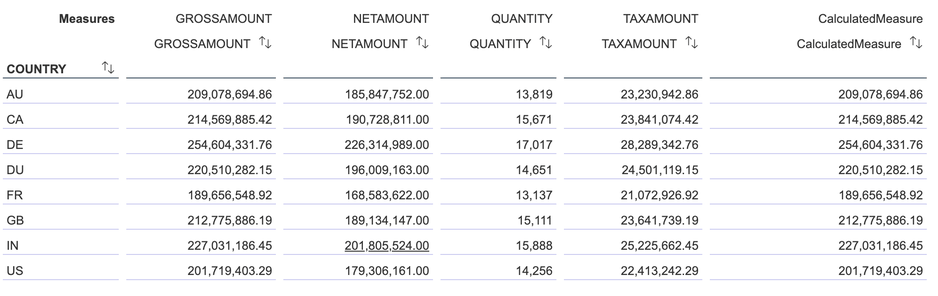
    Datasphere: Analytic Model Preview
    Datasphere: Analytic Model Preview

    If I now add the Product ID, I can switch to present the hierarchy and this is how it looks:
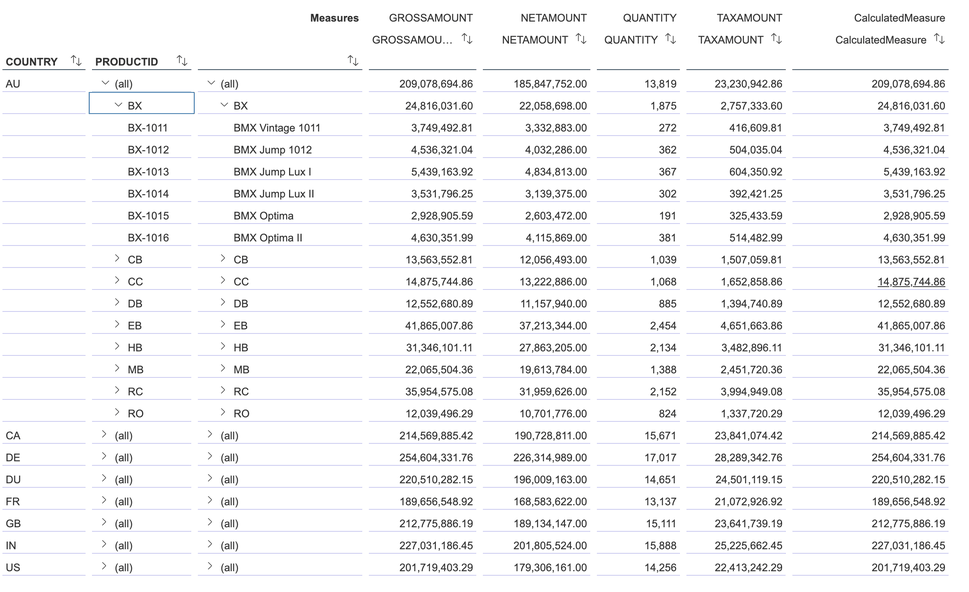
    Datasphere: Analytic Model Preview with Hierarchy and Texts
    Datasphere: Analytic Model Preview with Hierarchy and Texts

    As you see, the text which is associated to the Product ID dimension is displayed and the hierarchy which is available is also displayed. This is a real benefit for a short data analyze when you
    don’t want to create a SAC Dashboard to see the data. Another feature of the Analytic Model is that you have the possibility to create restricted and calculated key figures. You can create basic
    calculated key figure but also calculated key figures with exception aggregations.

    Exception Aggregation

    The calculated key figures can have the following aggregation types:

    • SUM
    • MIN
    • MAX
    • COUNT/COUNTNULL/COUNTNULLERO
    • AVG/AVERAGENULL/AVERAGENULLZERO
    • STD
    • FIRST
    • LAST

    So now the Analytic Model gives you a lot of possibilities which are only provided before by a SAP BEx Query.  Besides the calculated key figures, we have now restricted key figures.

    Restricted Key figures

    The restricted key figures can be set to a fix value or can be filled with a variable depending on your needs. Which is nice because this input parameter is published to the SAP Analytic Cloud,
    so the end user can filter the value they require. Based on the restriction, you can also add an exception aggregation with the same aggregation types the calculated key figure has (see above).

    Conclusion

    I think the Analytic Model will push the Datasphere to the next level. It is now possible as a data architect to have a preview of the data the department will see in the SAC. So the
    understanding is better, and we have now the possibility to create restricted and calculated key figures in the data model and reuse them in the SAC Story. So you don’t have to create them every
    time again. We will see how the Analytic Model will develop, but at the moment there are some ideas on the road map. My favorite is here, the support of the Business Layer. What are your thoughts
    on the Analytic Model? Let me know in the comments.

    author.


    Hi,

    I am Tobias, I write this blog since 2014, you can find me on LinkedIn and
    YouTube. I work as a Data &
    Analytics Consultant. If you want, you can leave me a PayPal coffee donation.
    You can also contact me directly if you want.


  • Create a time hierarchy in SAP Datasphere

    Update 01/2025

    Name changed from SAP Data Warehouse Cloud to SAP Datasphere. Some links may break

    Someone ask me how you could create a time hierarchy in SAP Datasphere (DSP) to use it in SAP Analytics Cloud (SAC). Because out of the box by just create the time dimension it isn’t working
    right now. So here are the steps you have to make.

    1. Create a new Space

    First we create a new space and start from scratch.

    SAP Datasphere Create new space
    SAP Datasphere Create new space
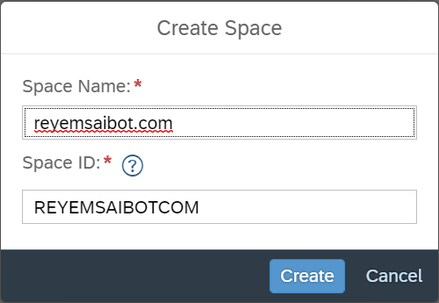
    SAP Datasphere Create space reyemsaibot.com
    SAP Datasphere Create space reyemsaibot.com

    After we created our new space and added our user to this space, we are able to create the time dimensions direclty in SAP Datasphere.

    SAP Datasphere Add time dimension to space
    SAP Datasphere Add time dimension to space
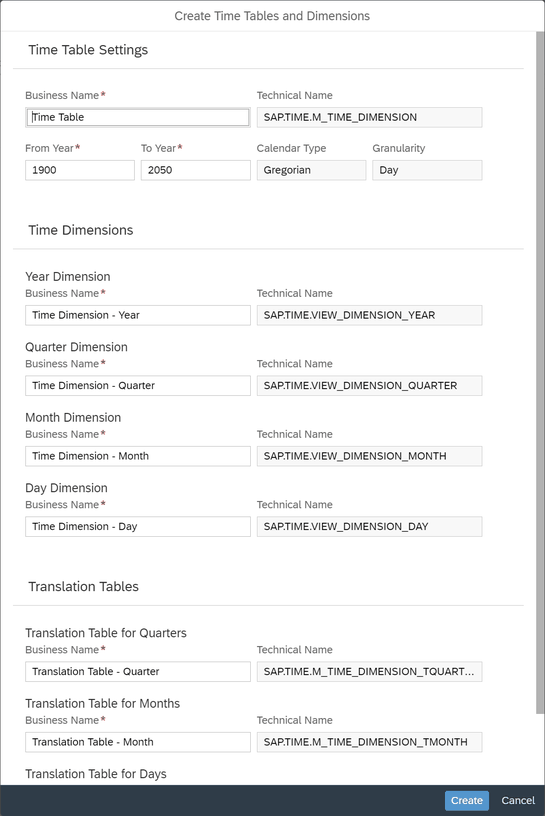
    SAP Datasphere Create time dimension
    SAP Datasphere Create time dimension

    2. Data Builder and Upload an own file

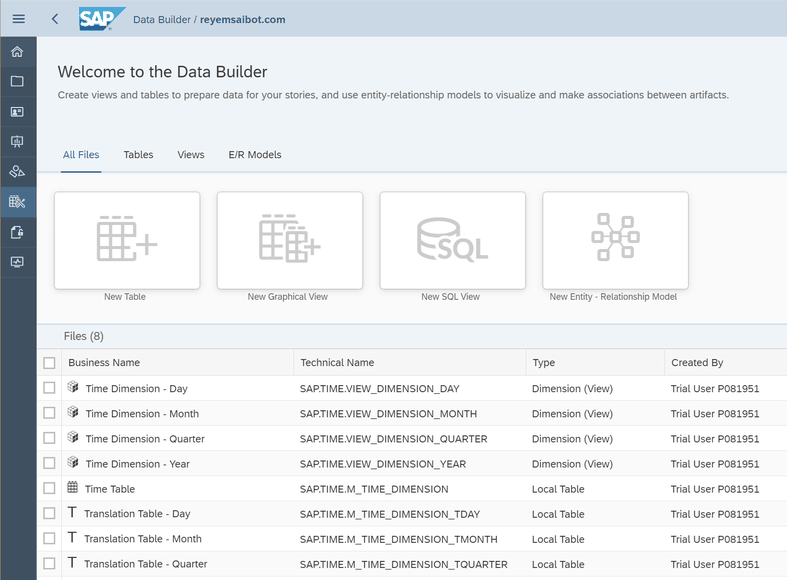
    Now we see in the Data Builder of the SAP Datasphere the time dimensions we just created. 

    SAP Datasphere Data Builder
    SAP Datasphere Data Builder

    To show you an example I need to upload some example data. We use for this the CSV-File upload functionality of Datasphere. 

    SAP Datasphere Import CSV File
    SAP Datasphere Import CSV File

    My example file here are the sales orders with a date in one column, so we can build our hierarchy.

    SAP Datasphere Import CSV File
    SAP Datasphere Import CSV File

    3. Create a new graphical view

    After I uploaded my files, we can create a new graphical view to associate our time dimension to our sales data.

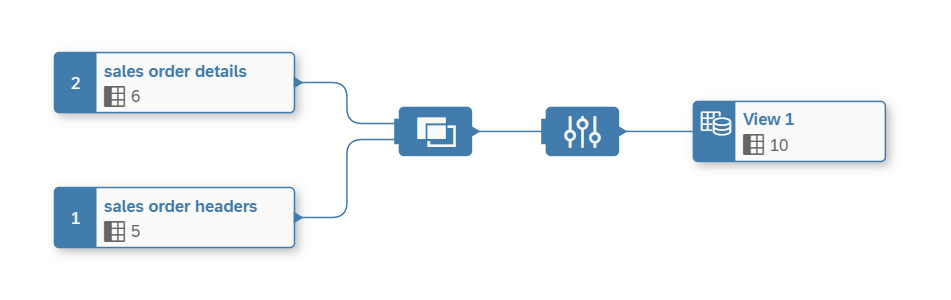
    SAP Datasphere Graphical View
    SAP Datasphere Graphical View

    As you see the view is very simple we just join the sales order header with the details. Now we can assign in the properties of the view element our time dimension.

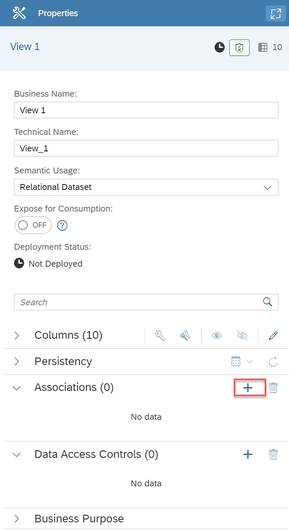
    SAP Datasphere Properties of View
    SAP Datasphere Properties of View

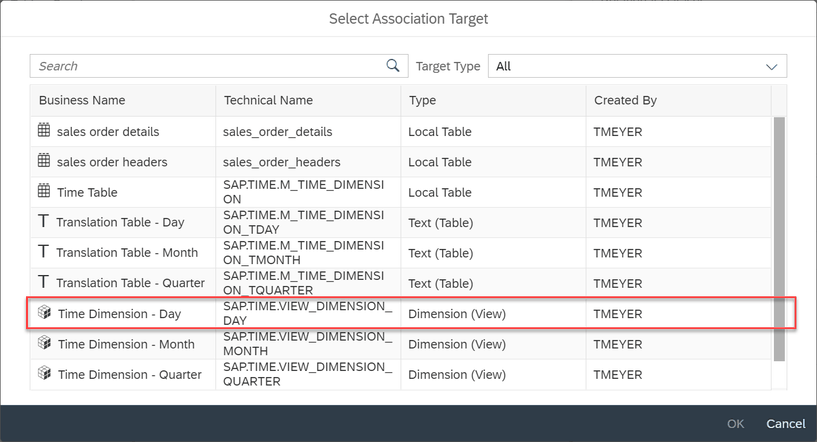
    Now we can select our association target and here we select the time dimension day and click OK.

    SAP Datasphere Select association target
    SAP Datasphere Select association target

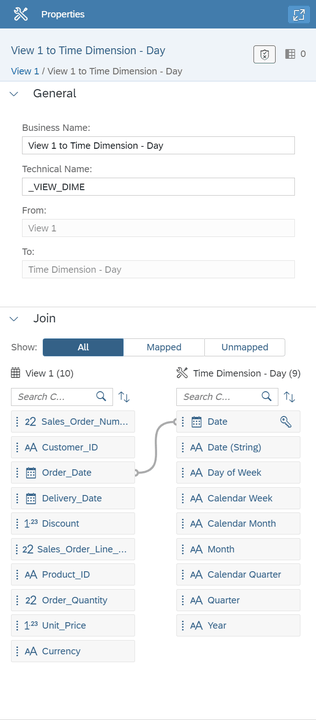
    Now we have to join our view with the time dimension. In my case I use the order date for my hierarchy.

    SAP Datasphere Join between view and association target
    SAP Datasphere Join between view and association target

    As penultimate step of this view we define our view as an Analytical Dataset and expose it for consumption.  As last step we save and deploy our view to make it available in the SAP
    Analytics Cloud.

    4. Create SAC Story

    Now after we have deployed our view we can switch through the application switcher to the SAP Analytics Cloud.

    SAP Datasphere Switch to SAP Analytics Cloud
    SAP Datasphere Switch to SAP Analytics Cloud

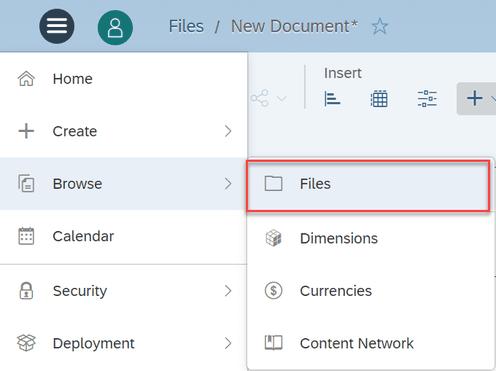
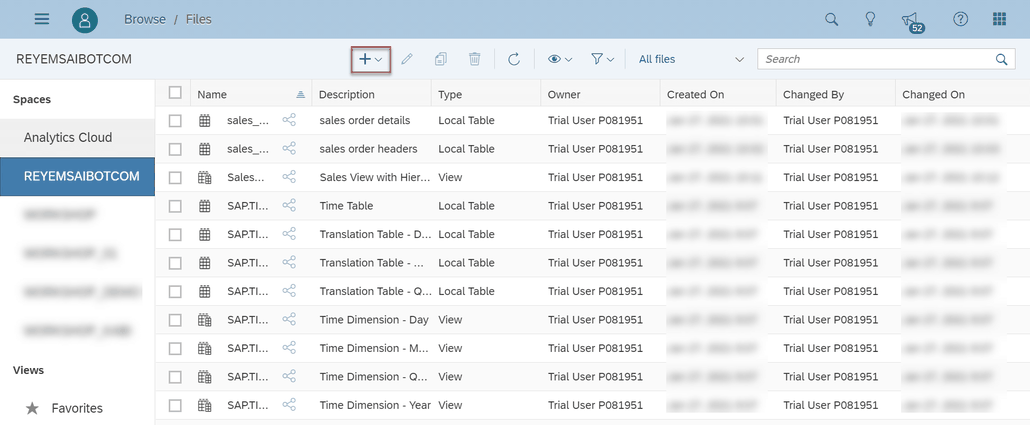
    We open via the menu our corresponding space and create a new story there.

    SAP Analytics Cloud Browse Files
    SAP Analytics Cloud Browse Files
    SAP Analytics Cloud Create new story
    SAP Analytics Cloud Create new story

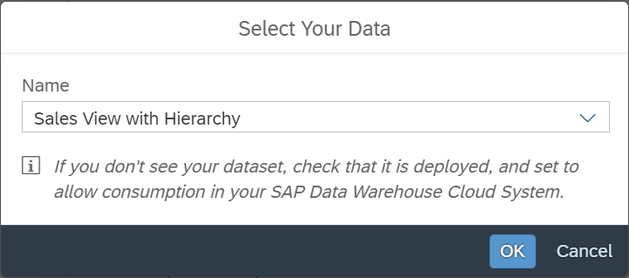
    Here we have to select our Analytical Dataset.

    SAP Analytics Cloud Select Dataset
    SAP Analytics Cloud Select Dataset

    After we selected our Analytical Dataset, we choose for the demonstration a table to show the hierarchy.

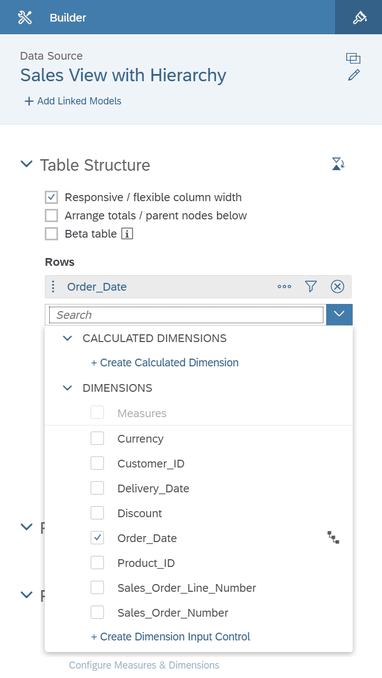
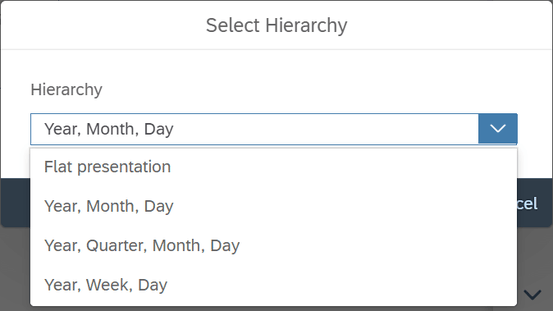
    Now we add the Order Date to our table and can select our corresponding hierarchy.

    SAP Analytics Cloud Add dimension with hierarchy
    SAP Analytics Cloud Add dimension with hierarchy
    SAP Analytics Cloud Select Hierarchy
    SAP Analytics Cloud Select Hierarchy

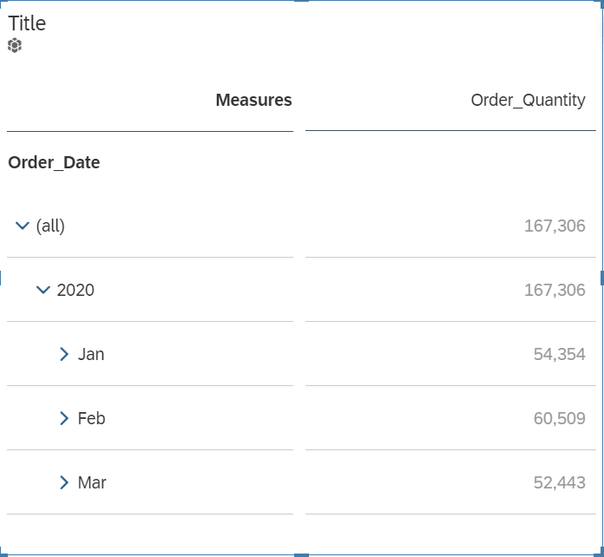
    As you see our table shows the time hierarchy.

    SAP Analytics Cloud Story with Table and Time Hierarchy
    SAP Analytics Cloud Story with Table and Time Hierarchy

    Conclusion

    When you know where the options are, it is not heavy to build a time hierarchy in SAP Datasphere and use it in SAP Analytics Cloud. I hope this will help to get started with Datasphere. If you
    have any questions, feel free to ask in the comments.

    author.

    Hi,

    I am Tobias, I write this blog since 2014, you can find me on Twitter,
    Facebook ,and YouTube. I work as a Data & Analytics
    Consultant. If you want, you can leave me a PayPal coffee donation. You can
    also contact me directly if you want.