reyemsaibot

SAP BI Blog about SAP BW/4HANA, Analysis for Office and SAP HANA - by Tobias Meyer

Autor: reyemsaibot

  • SAP Datasphere: Dynamic previous year in an Analytic Model

    It’s just before the summer break, and I want to share an idea on how to get a dynamic prior year in an analytical model.


    There are several questions in the SAP community how to get such a result as it was used in SAP BW. Like this one https://community.sap.com/t5/finance-q-a/offsetting-input-parameters-in-datasphere-s-analytic-models-restricted/qaq-p/13723947


    In this post, I want to share an idea on how to get such an offset in SAP Datasphere. Let’s go to our fact view and add some logic that we will use later in our analytic model.


    First we will add an input parameter to the bicycle data model, later I will describe another way if you don’t want to use an input parameter. 


    The input parameter in this case is called IP_YEAR, has no input help, and has a string data type with a length of 4.
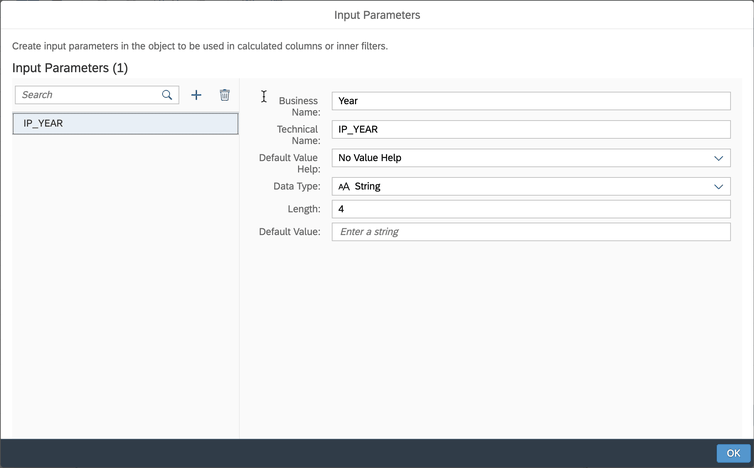
    Create an Input Parameter in SAP Datasphere
    Create an Input Parameter in SAP Datasphere

    Now let’s use the input parameter to complete the logic. Add a calculated column to the view. If you are building the view in pure SQL, add the logic accordingly.


    The new column provides the following information that we will use later. The current year is period 0, the previous year is period 1, and the year before that is period 2. I use the delivery
    date as the reference data.


    The CASE statement looks like this

    CASE WHEN DELIVERYDATE BETWEEN TO_DATE(ADD_YEARS(:IP_YEAR||'0101',-1)) AND 
            TO_DATE(ADD_YEARS(:IP_YEAR||'1231',-1)) THEN 'P1'
            WHEN DELIVERYDATE BETWEEN       TO_DATE(ADD_YEARS(:IP_YEAR||'0101',-2)) AND 
            TO_DATE(ADD_YEARS(:IP_YEAR||'1231',-2)) THEN 'P2'
            WHEN DELIVERYDATE BETWEEN       TO_DATE(ADD_YEARS(:IP_YEAR||'0101',0)) AND 
            TO_DATE(ADD_YEARS(:IP_YEAR||'1231',0)) THEN 'P0'
    END 
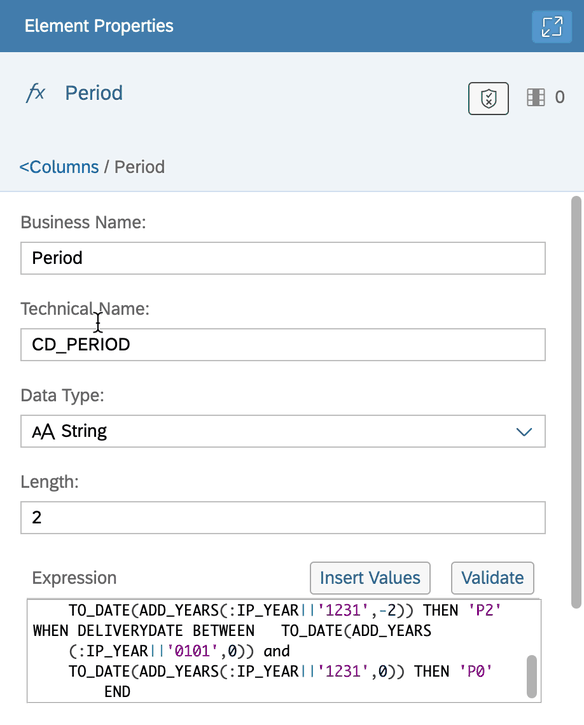
    
    Add a new calculated column
    Add a new calculated column

    The 2020 data preview now looks like this:
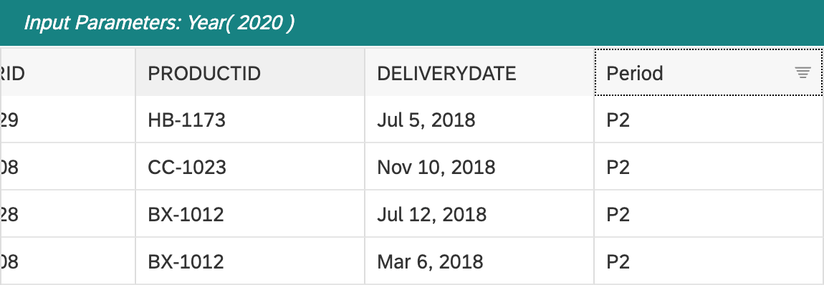
    Data preview of the view
    Data preview of the view

    Now we have all the requirements for the analytical model to create a dynamic selection. So we open the analytic model and see what it looks like
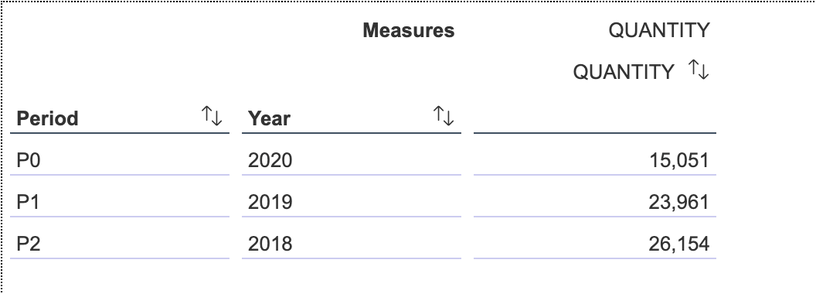
    Data preview in an Analytic Model
    Data preview in an Analytic Model

    The analytic model shows the year deviation perfectly. Now the next step is to create separate key figures to get a better analysis. Go back to the analytical model and create 3 restricted
    measure. One for period 0, one for period 1 and the last one for period 2.

    Create a new restricted measure
    Create a new restricted measure

    After creating all the restricted measures, we see this in the analytic model

    Analytic Model with restricted measures
    Analytic Model with restricted measures

    Now we can add the product ID to the rows and have a perfect overview of the sales quantity.

    Analytic Model with Product ID
    Analytic Model with Product ID

    As I wrote earlier, this is based on a variable that you have to set. If you don’t want to use a variable and just want to select the actual year with no flexibility, you could use the SQL
    function current_date instead of the input parameter in the view.

    Conclusion

    This is one idea, and maybe you have a better one you want to share. So I would love to read from you in the comments. I think it is a pretty simple solution to solve the previous year problem in
    an analytic model and can be used very easily. 

    author.


    Hi,

    I am Tobias, I write this blog since 2014, you can find me on LinkedIn and
    YouTube. I work as a Data &
    Analytics Consultant. If you want, you can leave me a PayPal coffee donation.
    You can also contact me directly if you want.


  • SAP Datasphere Hierarchies like in SAP BW

    ER-Model
    ER-Model


    For the hierarchy with directories, we need different tables directly from SAP BW.

    • RSHIEDIRT – for the hierarchy directory texts
    • RSHIEDIR – for the hierarchy master data
    • RSTHIERNODE – for the texts of the text nodes
    • /BIC/HZCDWC001 – for the hierarchy table of the Product Group InfoObject
    • /BIC/MZCDWC001 – for the product group master data
    • ZDWC007 – for the transaction data of the store


    The transaction data is contained in the Facts table for the store. The transaction data has an association to the Product Category dimension. The Product Group dimension has a hierarchy with
    directory assignment. 


    However, the main logic takes place in the view with the semantic type Hierarchy with Directory. In the Entity-Relationship Model, it is recognizable as „Product Group with Hierarchy Directory“.


    The directory has a text association with the hierarchy texts (table RSTHIERNODE), a dimension association with the hierarchy master data (table RSHIEDIR), which
    in turn has a text association with the hierarchy directory texts table (table RSHIEDIRT). So much for the structure of the Entity-Relationship model. 


    We start with the table Hierarchy Directory Tables (RSHIEDIRT). This is a remote table in the SAP BW system with the semantic usage Text.

    In the attributes of the table, the language key, the text, and the column name are defined.

    Remote Table
    Remote Table

    Next, we look at the Hierarchy Master Data table (RSHIEDIR). This table lists all the hierarchies that exist in the SAP BW system.


    To get only the data we need, we filter the hierarchy IDs we need. Using projection, we remove the unneeded columns and then calculate the date from to obtain a correct validity. The semantic use
    of views is dimensioning.

    RSHIEDIR View
    RSHIEDIR View

    The RSTHIERNODE table is used to obtain the texts associated with the hierarchy nodes. Filter the hierarchy IDs you require and hide the columns you do not need. 


    As semantic usage text and the columns with the necessary semantic types (language, text, description) are defined.

    RSTHIERNODE View
    RSTHIERNODE View

    Now the hierarchy is created with directories. The basis is the hierarchy table of the Product Group dimension (/BIC/HZCDWC001).


    First, various unneeded columns are hidden (e.g., object version, level of a hierarchy node). Then, the Hierarchy Node Name (NODENAME) column must be split into two columns to
    get a correct assignment for the hierarchy. One for the folder (0HIER_NODE) and one for the original InfoObject (ZCDWC001). So we have two new columns in this
    view: Leaf Node (ZCDWC001) and Node ID (0HIER_NODE).


    This view now forms the basis for the hierarchy with directories.

    Hierarchy Table of InfoObject
    Hierarchy Table of InfoObject

    The calculation of the new columns had to be moved to a separate view, otherwise it would lead to an error. As a semantic usage for the following view, we use Hierarchy with Directory and then
    define our settings. If necessary, the dimension assignment to the hierarchy’s master data must be done beforehand.

    Graphical View of Product Group Hierarchy
    Graphical View of Product Group Hierarchy

    In the details panel, we now make the settings for the hierarchy with directory.

    Modelling Hierarchy
    Modelling Hierarchy

    We define the Parent Column and the Child Column. We also need to select the column containing the name or ID of the hierarchy. The association with the Hierarchy Directory Entity (Hierarchy
    Master Data) should be done automatically by the previous association.


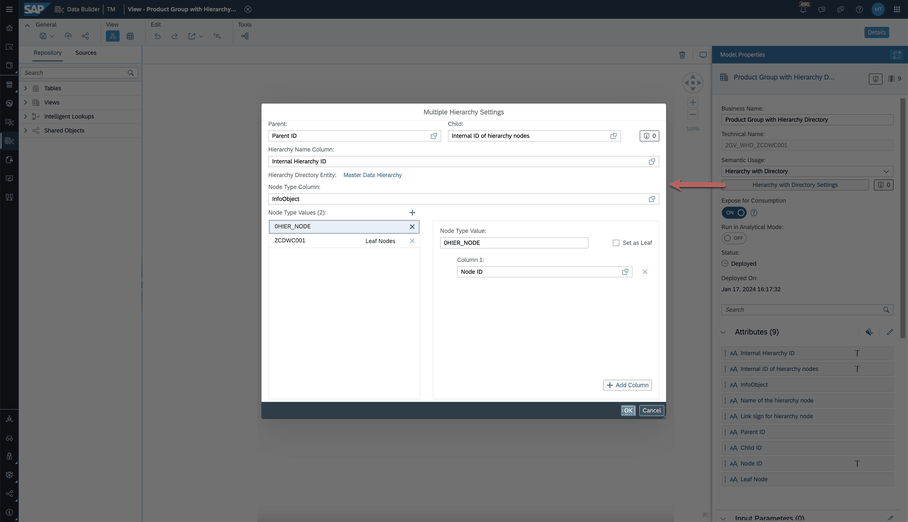
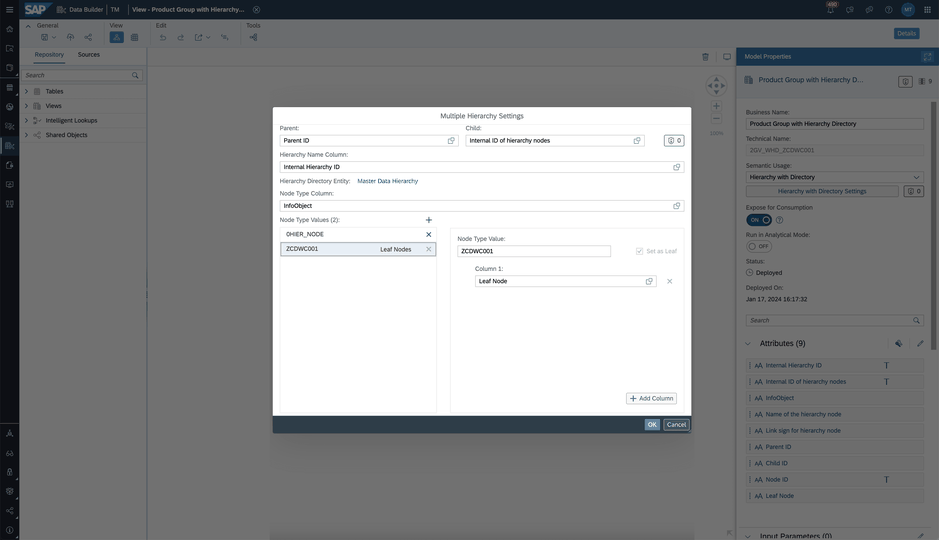
    Next, we define the Nodetype column. The last step is the definition of the node value. Once for the folder (0HIER_NODE) and the corresponding column (NODE_ID)
    and then also for the individual leaves of the hierarchy. Here is the InfoObject ZCDWC001 with the Leaf Node column. 

    Define Node types
    Define Node types

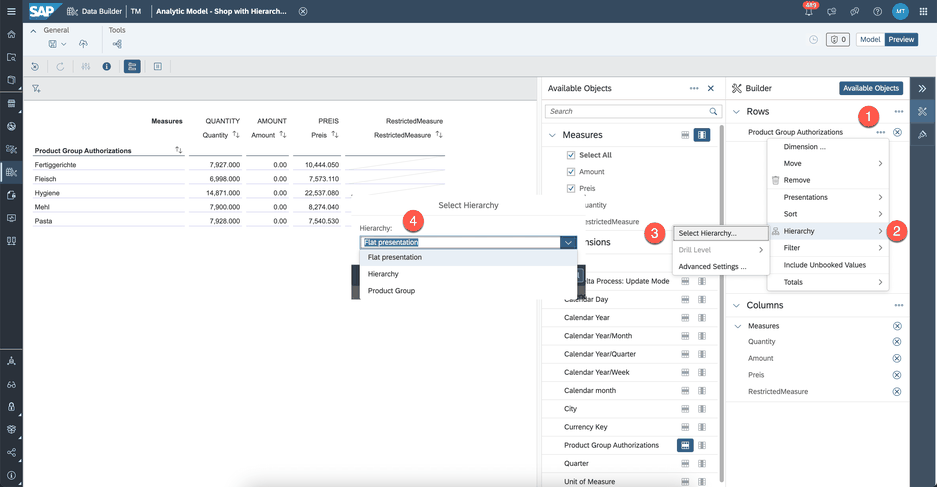
    By clicking OK, the hierarchy can be implemented and published. Afterward, the association with the dimension Product Group can be performed. In the analytical model, the hierarchy can now be
    selected for the dimension

    Analytic Model switch hierarchies
    Analytic Model switch hierarchies

    Conclusion

    This is one way to model hierarchies in SAP Datasphere. In this post, I get all the information directly from the old BW and reuse it to build a data model in Datasphere. If you have any thoughts
    or ideas, please post them in the comments.

    author.


    Hi,

    I am Tobias, I write this blog since 2014, you can find me on LinkedIn and
    YouTube. I work as a Data &
    Analytics Consultant. If you want, you can leave me a PayPal coffee donation.
    You can also contact me directly if you want.


  • Review 2023 and outlook

    I know it’s been a long time since I wrote the last post, and also make some housekeeping on the site. But the last quarter was as always very busy with different topics. I have now four pilot
    projects with SAP Datasphere, which I have to manage and develop the cool stuff.  😉 For example, how to use the command line interface (CLI) for SAP Datasphere to create views or tables
    based on a remote table. I had a really cool meeting with Ronald & Tim about this topic – Thank you guys for the input, now I have more ideas and less time.

    I also developed some cool quarter slices in my projects to fulfil the customer needs. But besides the Datasphere projects I had this year, I also did a lot of other stuff. Let’s start in March
    with the DSAG Technologie Tage in Mannheim. It was quite fun. You find all slides and posts on LinkedIn.

    Since April, I now officially promoted to the Solution Expert Enterprise Data Warehouse – so now I don’t work full time on projects I now work on different areas like presentations, presales, and
    also some Proof of Concepts.


    I was on stage on the BI Vision in May (see the video here in German). Then I was on parental leave for two months which was really cool, and we had a
    great time. I also spoke at the BI Fokustage in Hamburg, Neu-Ulm and also at the online Fokustag. In October, I also spoke at the HANA Technight in Mannheim, organized by Jörg. You can download
    the slides of HANA Technight here.


    At the end of the year we have now different PoC of SAP Datasphere with various customers. There are some fascinating use cases like time dependency on dimensions which give you only the current
    value out of the system. We also had some performance issues which we had to solve. There is an interesting note 2567999 which shows
    you an example on how to push down filters on ABAP connections.

    To make a review of a year complete, I also want to throw some data like everyone else on LinkedIn into the world. I think this is the perfect answer to the question Jonas asked each time in his
    podcast.


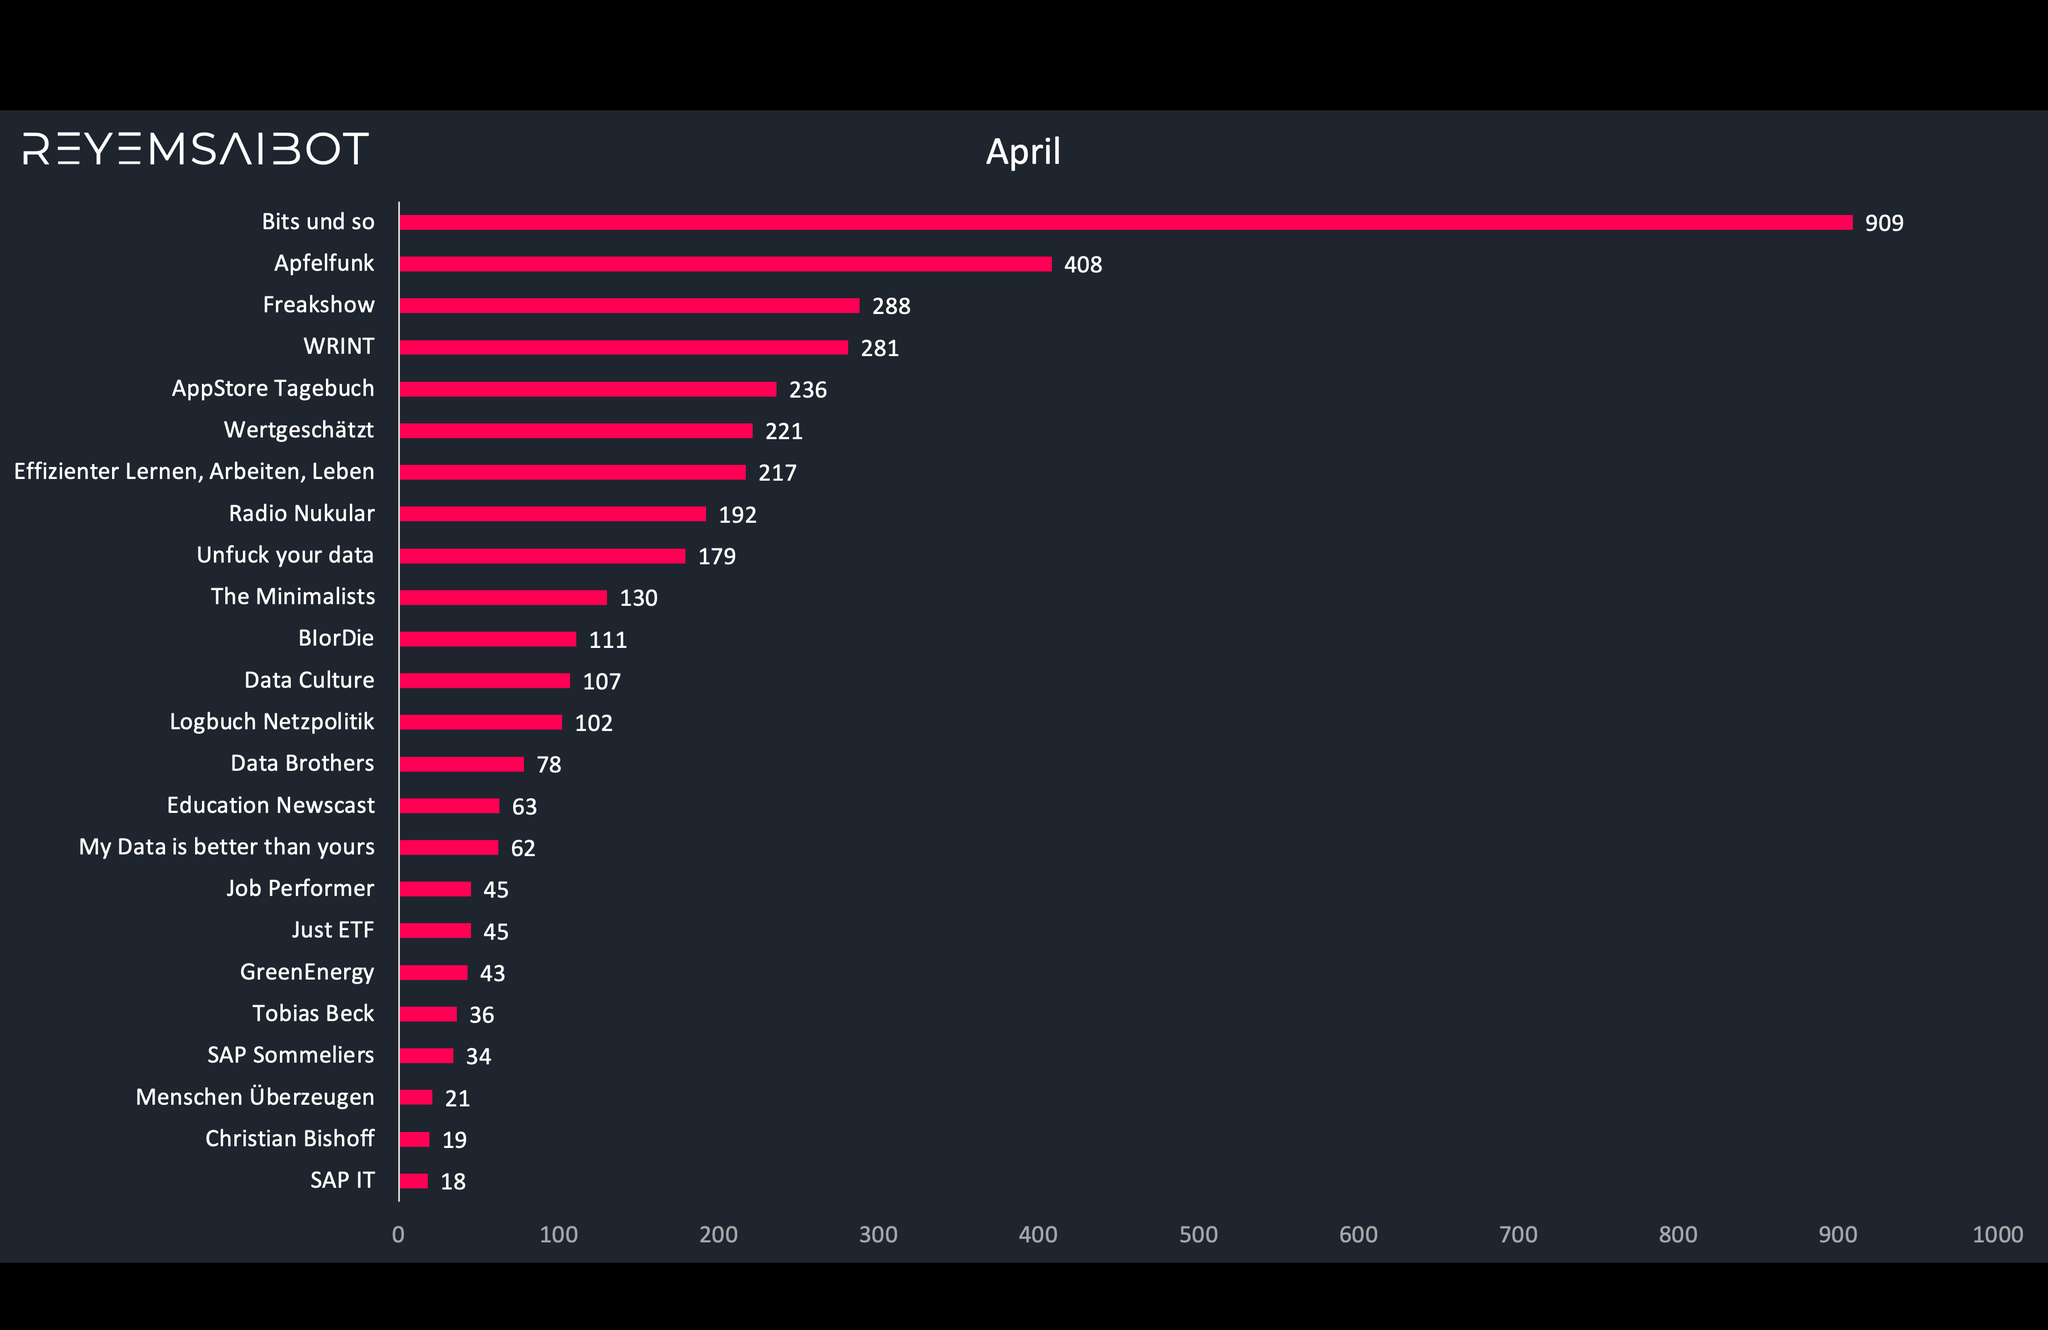
    In 2023, I read 13 books, listened to 36030 minutes podcasts. These are over 25 days in 45 different podcasts. My
    most played podcasts are Bits und so, Apfelfunk, WRINT, Wertgeschätzt and My Data is better than yours A detailed monthly analysis can be found in the following pictures.

    But besides the books and podcasts, I also measured some data with my Apple Watch. I walk around 4.2 million steps over the year, with the most steps in August. On average, I have 11500 steps per
    day. Which I think for a pure office worker is an excellent number. 


    I also run some kilometers. In 2023, it was only 520 km, nothing comparing to 2021 but still some workouts over the year. 

    Conclusion

    For me, it is clear, I have to write more about my current projects and also about some issues I have with SAP Datasphere. Therefore, I planned my 12-Week Year with different topics. Some are
    private goals and some are business related goals. I also plan to do more exercises this year (who doesn’t have this thought in January?) – So we will see at the end of the year what I
    archived. 

    author.


    Hi,

    I am Tobias, I write this blog since 2014, you can find me on twitter,
    facebook and youtube. I work as a Senior Business
    Warehouse Consultant. In 2016, I wrote the first edition of . If you want, you can leave me a paypal coffee donation.
    You can also contact me directly if you want.


  • Consume hierachies with text nodes in SAP Datasphere

    It was quite a bit silent here. That’s a fact. I had a lot on my plate since I have a new job and also before the promotion. But now I have a super cool topic on my mind I want to share with you.


    Hierarchies are a common topic in companies. They offer the business users‘ flexibility to navigate in the frontend reports. In this example, I flatten the hierarchy structure to consume a
    hierarchy with text nodes and infoobjects. The Product Group hierarchy looks like the following screenshot. 

    SAP BW hierarchy
    SAP BW hierarchy

    The hierarchy has one top node for all entries and then different groups with some nodes. (I only have this screenshot with German descriptions because the data model has here German words used).


    The following screenshot shows the hierarchy displayed in SE16 with all levels and relations.

    SE16 Preview
    SE16 Preview

    I have this idea from this blog post on blogs.sap.com, and I now use this
    technique to get my hierarchy into SAP Datasphere. I use here a SQLScript View to build all necessary information in one view. You can also choose a different approach.

    First View

    This code on the hierarchy table restrict the data to get the top level, so we only have the root in the result.

    top_level = select "NODEID",
                       "NODENAME" as "LEVEL1",
                       "TLEVEL",
                       "PARENTID",
                       "IOBJNM"
                  from "HZCDWC001"
                 where "OBJVERS" = 'A'
                 and   "NODEID" = '00000006';
    

    Second View

    This code defines on the same hierarchy table all levels, excluding the top level.

    top_level = select "NODEID",
                       "NODENAME" as "LEVEL1",
                       "TLEVEL",
                       "PARENTID",
                       "IOBJNM"
                  from "HZCDWC001"
                 where "OBJVERS" = 'A'
                 and   "NODEID" = '00000006';
        
    child_level = select "NODEID",
                         "NODENAME" as "LEVEL1",
                         "TLEVEL",
                         "PARENTID",
                         "IOBJNM"
                    from "HZCDWC001"
                   where "OBJVERS" = 'A'
                   and   "NODEID" <> '00000006';


    Third View

    To achieve the outcome (a flat hierarchy) I join now the first internal table with the second using nested joins between NODEID and PARENTID to get the parent child relationship.

    It is only flattened up to level 3, because the hierarchy does not have more levels, but can be extended even further if needed.

    top_level = select "NODEID",
                       "NODENAME" as "LEVEL1",
                       "TLEVEL",
                       "PARENTID",
                       "IOBJNM"
                  from "HZCDWC001"
                 where "OBJVERS" = 'A'
                 and   "NODEID" = '00000006';
        
    child_level = select "NODEID",
                         "NODENAME" as "LEVEL1",
                         "TLEVEL",
                         "PARENTID",
                         "IOBJNM"
                    from "HZCDWC001"
                   where "OBJVERS" = 'A'
                   and   "NODEID" <> '00000006';
                  
    all_levels = select L1."LEVEL1",
                        L2."LEVEL1" as "LEVEL2",
                        L3."LEVEL1" as "LEVEL3"
                   from :top_level as "L1"
                   left outer join :child_level as "L2"
                   on L1."NODEID" = L2."PARENTID"
                   left outer join :child_level as "L3"
                   on L2."NODEID" = L3."PARENTID";
            
    return select "LEVEL1",
                  "LEVEL2",
                  "LEVEL3"
             from :all_levels;
    

    The data preview displays the flatten structure of the hierarchy

    Preview SAP Datasphere
    Preview SAP Datasphere

    Now I can create a dimension with a level hierarchy and consume it in my transactional data. Therefor I change the semantic usages to Dimension

    Create dimension in SAP Datasphere
    Create dimension in SAP Datasphere

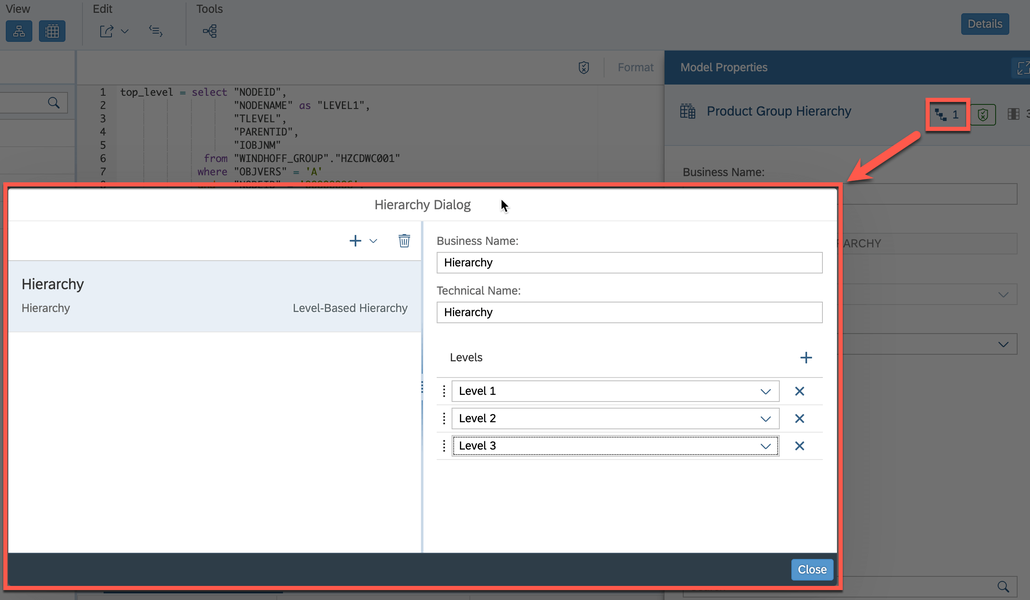
    After that is done, I create a hierarchy.

    Create a hierarchy in SAP Datasphere
    Create a hierarchy in SAP Datasphere

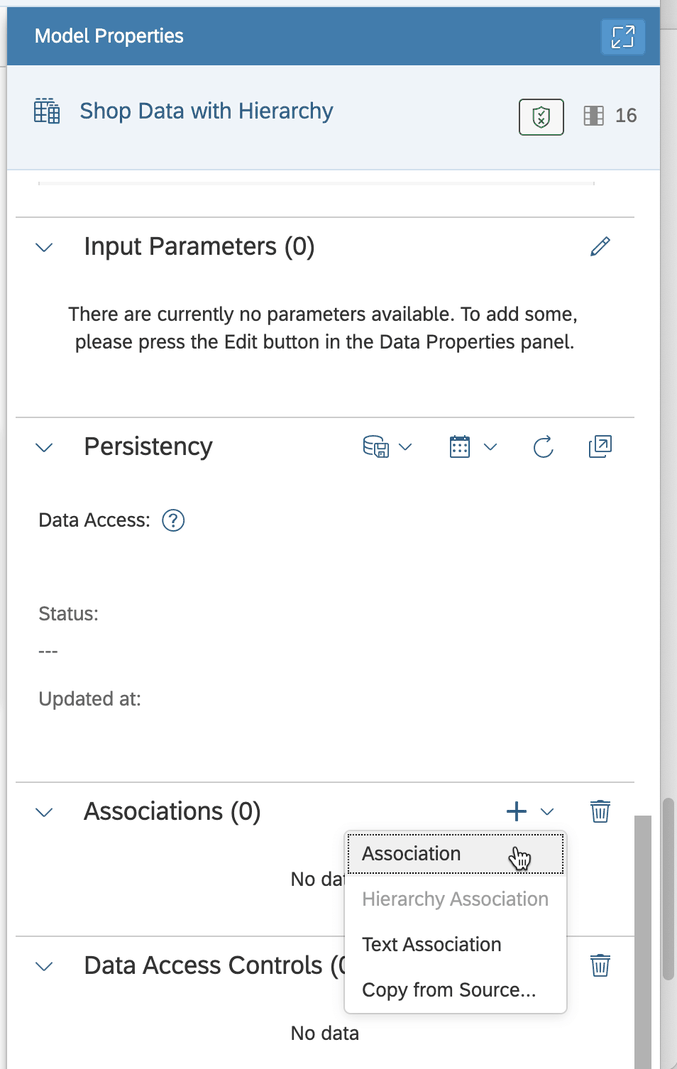
    Now we can deploy the dimension and use it in the transactional view. Add the association.

    Create an association to the dimension in SAP Datasphere
    Create an association to the dimension in SAP Datasphere

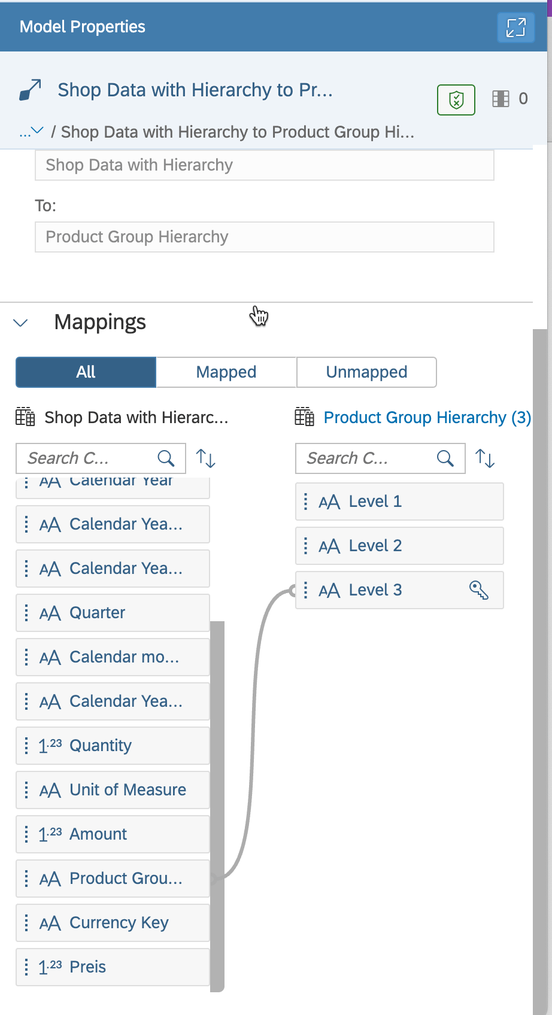
    Create the mapping between the fact data and the hierarchy dimension.

    Create the mapping between the fact and dimension table
    Create the mapping between the fact and dimension table

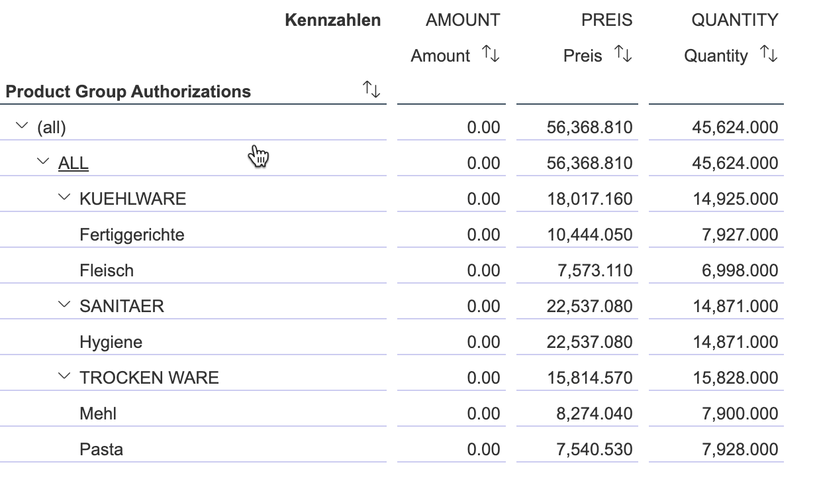
    The last step is to use the fact model in an Analytic Model and analyze the data.

    Data Preview of the Analytic Model in SAP Datasphere
    Data Preview of the Analytic Model in SAP Datasphere

    Conclusion

    At the moment (end of May 2023) the hierarchies with text nodes are not supported yet from SAP Datasphere. So I think it is one way to go. If you have another way, please let me know in the
    comments or through LinkedIn. Next post will be how to use this concept and authorizations in SAP Datasphere.

    author.


    Hi,

    I am Tobias, I write this blog since 2014, you can find me on LinkedIn and
    YouTube. I work as a Data &
    Analytics Consultant. If you want, you can leave me a PayPal coffee donation.
    You can also contact me directly if you want.


  • Data Warehouse Cloud Analytic Model is available

    Update 01/2025

    Name change from SAP Data Warehouse Cloud to SAP Datasphere. Some links may break.

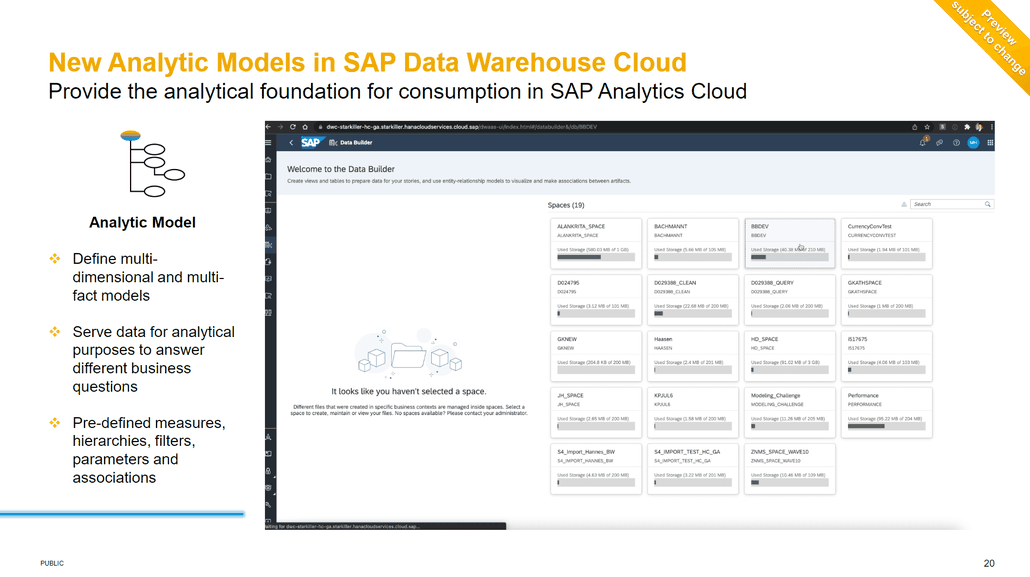
    The Datasphere Analytic Model is now on all tenants available. With this wave, you have now the possibility to use instead of an Analytical Dataset (ADS) the new Analytic Model. The Analytic
    Model is a kind of cube which allows you to slice and dice your data model. I wrote about the preview access on December,
    and now I want to show you some details.

    Datasphere: Analytic Model
    Datasphere: Analytic Model

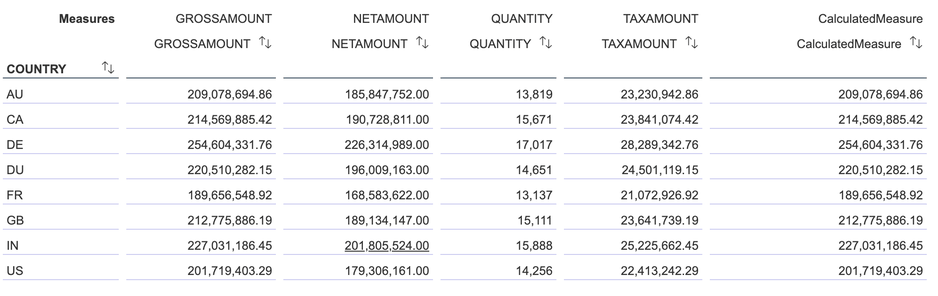
    The Analytic Model is the new place to go as a model for the SAP Analytics Cloud (SAC). It allows adding several dimensions and build a nested view of your data. As you see in the screenshot
    above, you have now the possibility to make slice and dice like in Analysis for Office. You can easily drag and drop the dimensions to the columns/rows and build the view of the data you need.

    Datasphere: Analytic Model Preview
    Datasphere: Analytic Model Preview

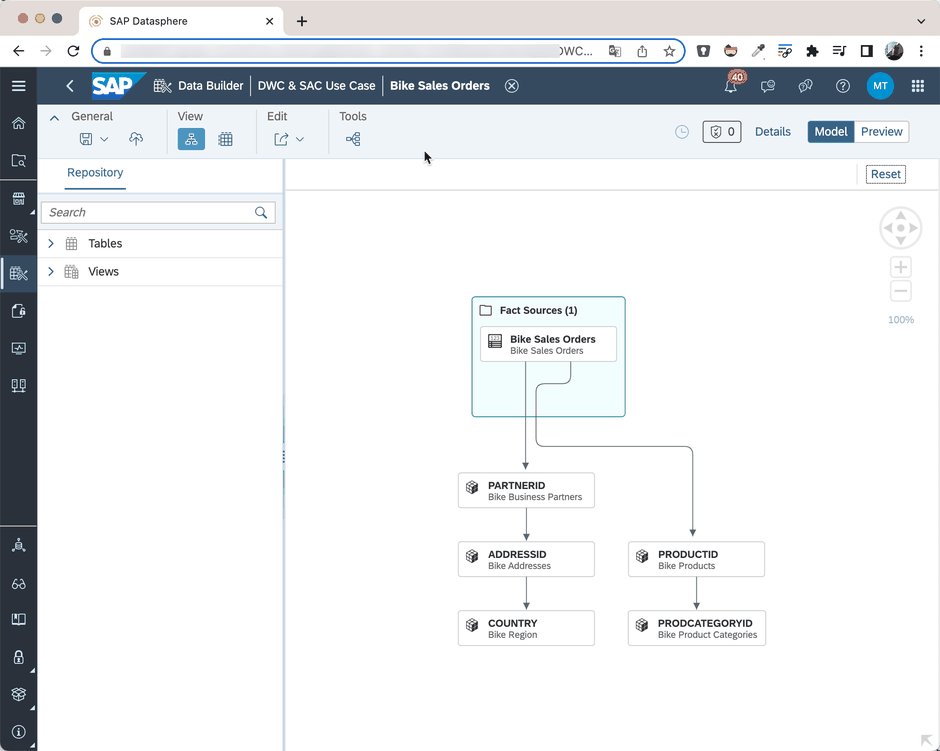
    As you see in the screenshot, the Bike Sales Orders fact model has two dimensions, the Partner ID and the Product ID. But I have now the possibility to go further down. For example, from the
    Partner ID to the Address ID and then to the Country dimension. So I have texts or hierarchies available which are build on the country dimension. This is how it looks like in the preview.

    Datasphere: Analytic Model Preview
    Datasphere: Analytic Model Preview

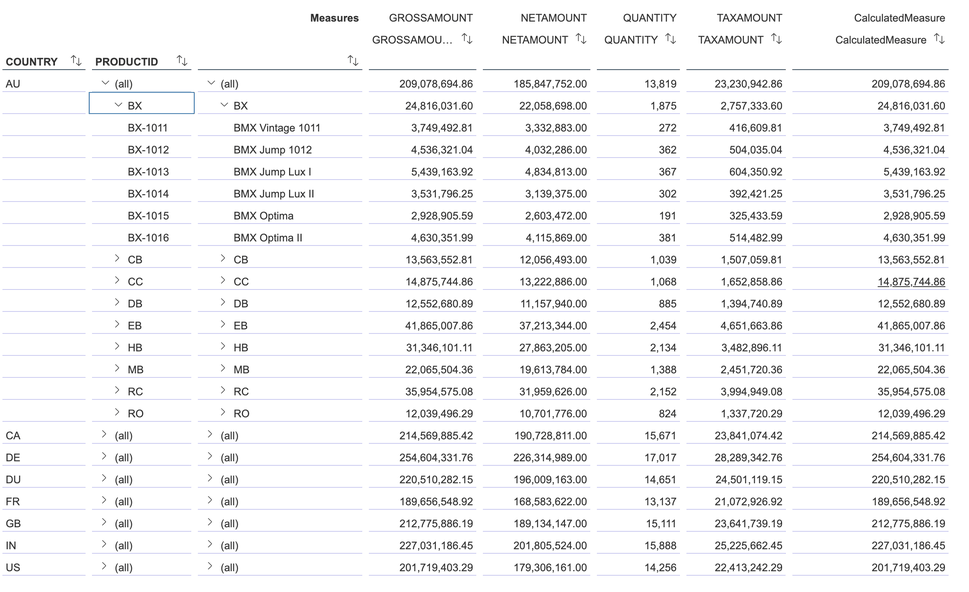
    If I now add the Product ID, I can switch to present the hierarchy and this is how it looks:

    Datasphere: Analytic Model Preview with Hierarchy and Texts
    Datasphere: Analytic Model Preview with Hierarchy and Texts

    As you see, the text which is associated to the Product ID dimension is displayed and the hierarchy which is available is also displayed. This is a real benefit for a short data analyze when you
    don’t want to create a SAC Dashboard to see the data. Another feature of the Analytic Model is that you have the possibility to create restricted and calculated key figures. You can create basic
    calculated key figure but also calculated key figures with exception aggregations.

    Exception Aggregation

    The calculated key figures can have the following aggregation types:

    • SUM
    • MIN
    • MAX
    • COUNT/COUNTNULL/COUNTNULLERO
    • AVG/AVERAGENULL/AVERAGENULLZERO
    • STD
    • FIRST
    • LAST

    So now the Analytic Model gives you a lot of possibilities which are only provided before by a SAP BEx Query.  Besides the calculated key figures, we have now restricted key figures.

    Restricted Key figures

    The restricted key figures can be set to a fix value or can be filled with a variable depending on your needs. Which is nice because this input parameter is published to the SAP Analytic Cloud,
    so the end user can filter the value they require. Based on the restriction, you can also add an exception aggregation with the same aggregation types the calculated key figure has (see above).

    Conclusion

    I think the Analytic Model will push the Datasphere to the next level. It is now possible as a data architect to have a preview of the data the department will see in the SAC. So the
    understanding is better, and we have now the possibility to create restricted and calculated key figures in the data model and reuse them in the SAC Story. So you don’t have to create them every
    time again. We will see how the Analytic Model will develop, but at the moment there are some ideas on the road map. My favorite is here, the support of the Business Layer. What are your thoughts
    on the Analytic Model? Let me know in the comments.

    author.


    Hi,

    I am Tobias, I write this blog since 2014, you can find me on LinkedIn and
    YouTube. I work as a Data &
    Analytics Consultant. If you want, you can leave me a PayPal coffee donation.
    You can also contact me directly if you want.


  • Datasphere Analytic Model

    Update 01/2025

    Name change from SAP Data Warehouse Cloud to SAP Datasphere. Some links may break.

    Wow! It’s now a long time since I wrote the last blog post. I think many of my posts starts with this now. But anyway, let’s get back to the subject. I have the opportunity to have a look at the
    new Datasphere (DSP) Analytic Model. It was presented in the keynote of Hagen Jander and Eric Schemer on the DSAG Jahreskongress.

    Since last week I have a look at the Analytic Model and must say it is really cool. At the moment, I build a test with some demo data. So Stay tuned and we see us next year.


    Happy x-mas and a happy new year.

    author.


    Hi,

    I am Tobias, I write this blog since 2014, you can find me on LinkedIn and
    YouTube. I work as a Data &
    Analytics Consultant. If you want, you can leave me a PayPal coffee donation.
    You can also contact me directly if you want.


  • Custom Slide Shows in Microsoft PowerPoint

    It has been a while since I wrote the last blog post. But there happened a lot in the last two months. We had our Deep Dives about Self Service with SAP Data Analytics Cloud Architecture and I
    had also some weeks of vacation. Now I am back from my vacation, and now I want to share some ideas I had in the last months.


    This post is about Microsoft PowerPoint and how I use it to create a master PowerPoint file for different purposes. The idea was to have one place for all my SAP Data Warehouse Cloud slides and
    use them in different customer scenarios.


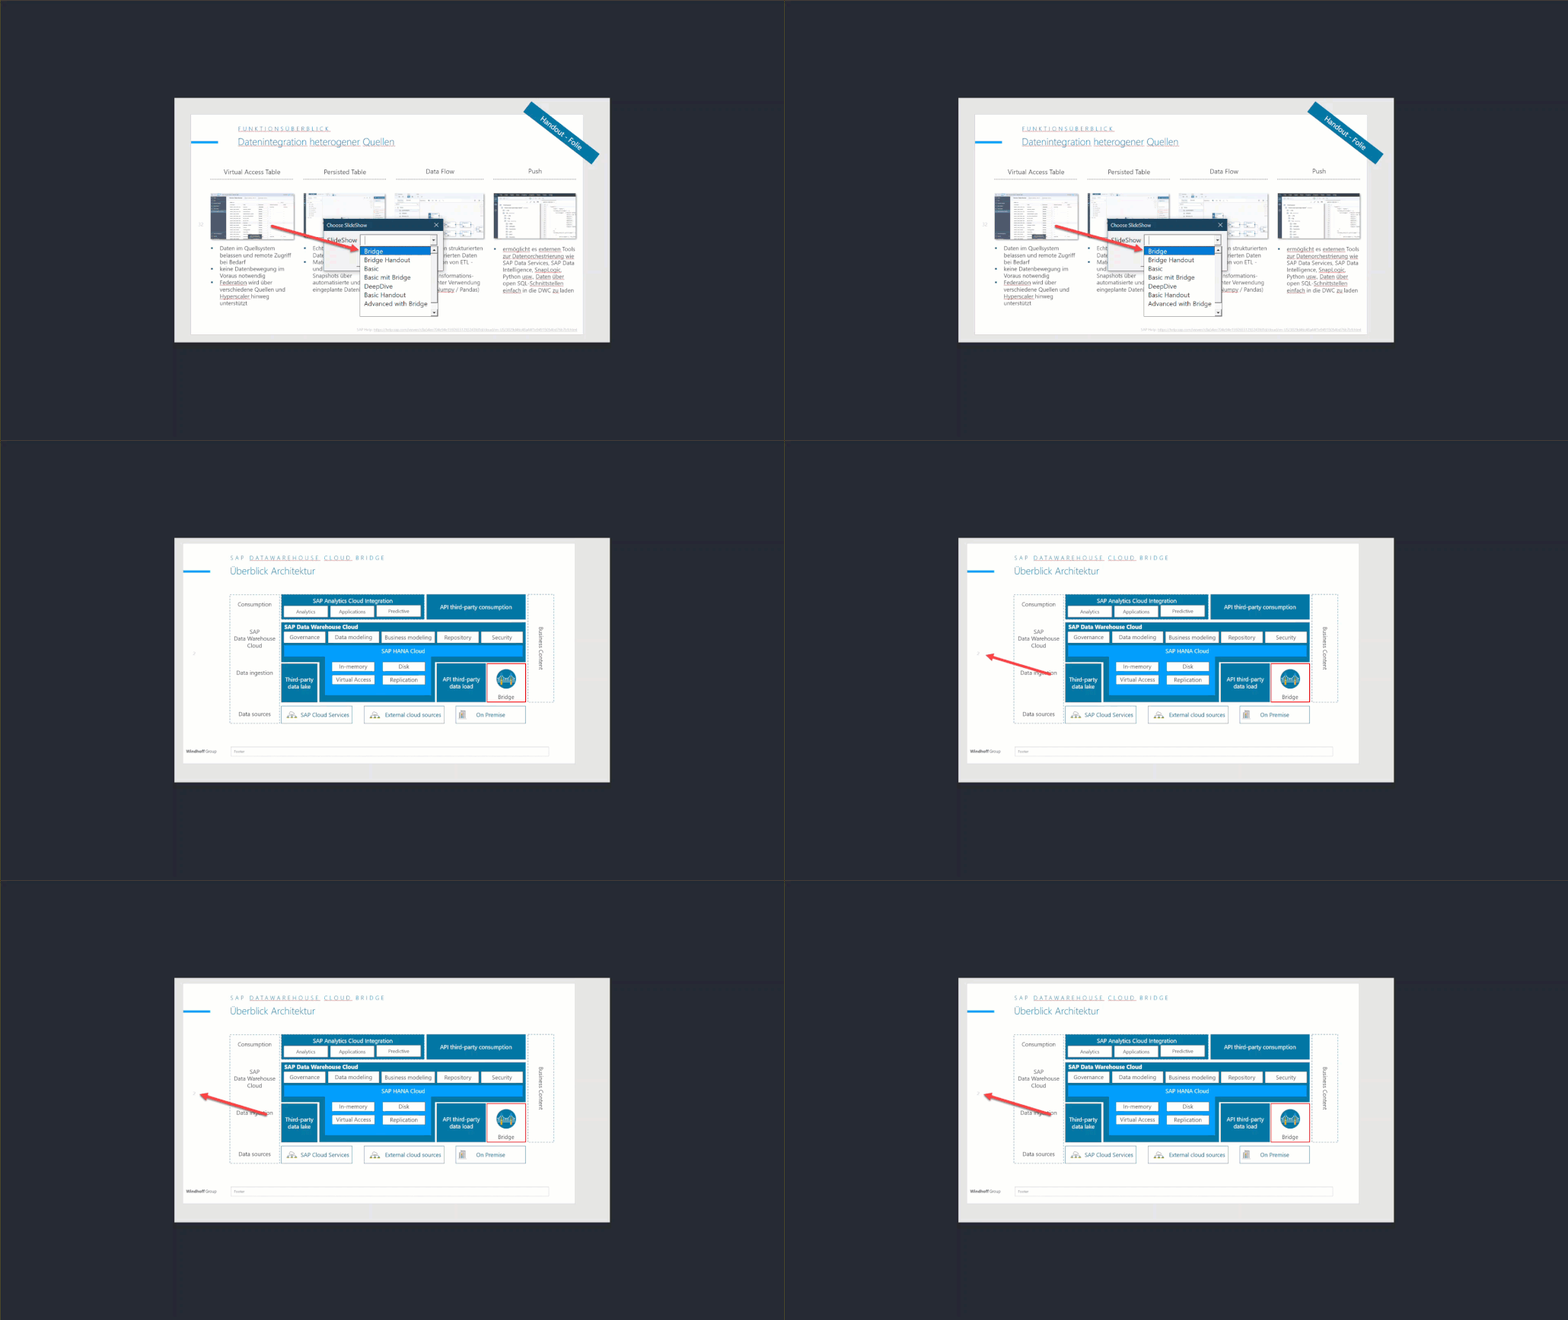
    Therefore, I search a little what I can do. If you have Microsoft Office 365, PowerPoint has the option of Custom Slide Shows under the tab Slide Show.

    Custom Slide Show in Microsoft PowerPoint
    Custom Slide Show in Microsoft PowerPoint

    This is nice, but not very handy. Because you have to add and sort all slides manually and also when a new slide is added you have to move it in the right position. Another problem is that when
    you have page numbers on your slide, in all presentations the slides have the page number, which is the slide number in your main presentation.


    For example, you use in a custom show slide the slide 1, 4 and 6 your page numbers in the show will not be 1,2 and 3 instead it will be 1, 4 and 6. This does not look right when you present it to
    a customer. So I wrote a little VBA macro to adjust the page numbers based on the custom slide show I choose.


    This is the code:

    Sub OnSlideShowPageChange(ByVal SSW As SlideShowWindow)
        
    Dim slideshow As String
    
        If SSW.View.CurrentShowPosition = SSW.Presentation.SlideShowSettings.StartingSlide Then
                  
            slideshow = ActivePresentation.SlideShowSettings.SlideShowName
            Call delete_page_numbers(slideshow)
            Call create_page_numbers(slideshow)       
        End If
    End Sub
    

    The code is triggered by a simple user form and delete first all page numbers (because some slides are used in different custom slide shows) and then create new page numbers for all pages of the
    custom slide show.


    The deletion code is this :

    Sub delete_page_numbers(slideshow As String)
    
    Dim idOfSlide As Variant
    Dim currentSlide As Slide
    
    For Each idOfSlide In ActivePresentation.SlideShowSettings.NamedSlideShows(slideshow).SlideIDs
    If idOfSlide <> 0 Then
        Set currentSlide = ActivePresentation.Slides.FindBySlideID(idOfSlide)
        On Error Resume Next
        Set tb = getTextBox("pageNumber", currentSlide.SlideIndex)
        tb.delete
    End If
    Next
    End Sub
    

    And the creation code is this:

    Sub create_page_numbers(slideshow As String)
    
    Dim number_of_slides As Integer
    
    Dim idOfSlide As Variant
    Dim currentSlide As Slide
    Dim page_number As Integer
    
    page_number = 1
    
    For Each idOfSlide In ActivePresentation.SlideShowSettings.NamedSlideShows(slideshow).SlideIDs
    
    If idOfSlide <> 0 Then
    
    Set currentSlide = ActivePresentation.Slides.FindBySlideID(idOfSlide)
        ' Master Slides without page number
        
        If currentSlide.CustomLayout.Name = "Einfache Seite" Or _
           currentSlide.CustomLayout.Name = "Agenda" Or _
           currentSlide.CustomLayout.Name = "Neuer Abschnitt" Or _
           currentSlide.CustomLayout.Name = "Deckblatt" Then
            page_number = page_number + 1
        Else
        
            With currentSlide
            ' Create a text box and add a page number in it.
                Dim PgNumShape As Shape
                Set PgNumShape = .Shapes.AddTextbox(msoTextOrientationHorizontal, 0, 254.5, 38, 28.75)
            
                ' Apply the formatting used for the slide number placeholder
                ' to the text box you just created.
                PgNumShape.Apply
            
                With PgNumShape
                    '.Fill.Visible = msoTrue
                    .Fill.ForeColor.RGB = RGB(255, 255, 255)
                    
                    'Font
                    With .TextFrame.TextRange.Font
                        .Name = "Segoe UI (Body)"
                        .Size = "12"
                        .Color = RGB(197, 197, 197)
                        
                    End With
                    
                    ' Textbox Properties
                    With .TextFrame
                        .MarginBottom = 3.6
                        .MarginTop = 3.6
                        .MarginRight = 7.2
                        .MarginLeft = 7.2
                        .AutoSize = ppAutoSizeNone
                        .VerticalAnchor = msoAnchorMiddle
                        .TextRange.Paragraphs.ParagraphFormat.Alignment = ppAlignRight
                   
                    End With
                    
                    .Name = "pageNumber"
                    
                End With
            
                ' Add the page number text to the text box.
                PgNumShape.TextFrame.TextRange = page_number
                page_number = page_number + 1
            
            End With
        
        End If
    
    End If
    
    Next
    
    End Sub
    

    As you see I only set page numbers on specific types of slides (not on the agenda, overview and so on) with a specific color and size.


    This is really cool and adds the missing function to my Custom Slide Show, which is not provided by Microsoft PowerPoint.


    I know this is not a specific SAP topic, but I think this could be interesting for other users which have to present sometimes. If you have any ideas what I can improve, please share it in the
    comments. Here is a short gif how it works:

    Page number adjusted on a custom slide show
    Page number adjusted on a custom slide show

    Conclusion

    I worked a lot in the last few months with PowerPoint and created a lot of presentation material. I wanted to make my presentation life easier, and so I created one master PowerPoint file and
    this one can have different slide shows based on the topic. So every change is only made in one file and all presentations which are referring to the slide have the same information on it.

    author.


    Hi,

    I am Tobias, I write this blog since 2014, you can find me on Twitter,
    LinkedInFacebook and YouTube. I work as a Senior Business Warehouse Consultant. In 2016, I wrote the first edition of . If you want, you can leave me a PayPal coffee donation. You can also contact me directly if you want.


  • Analysis for Office 2.8 SP14 is available

    Unfortunately, I didn’t make it to publish the post in the last month. There were several reasons that I didn’t make it, like the internal BI days or to prepare the next deep dive for Data
    Warehouse Cloud. But back to topic. SAP published Analysis for Office 2.8 SP14. Maybe there is something with the SP14 because Analysis Office 1.4 had also a SP14 before Analysis office 2.0 was
    released. So perhaps we see some new feature in the future?


    But back to Analysis for Office 2.8 SP14. Now you are able to connect to Data warehouse Cloud and consume the analytical data sets directly in Excel. This is the biggest update with for a long
    time with features. The last updates were mostly bug fixing and some technical setting parameter, but nothing what is fascinating.


    Besides the function in Analysis Office 2.8 SP12 repeat titles of a crosstab. The latest version also offers a new API method called SaveBwComments and some new technical settings like

    • AllowFlatPresentationForHierarchyNodeVariables
    • SapGetDataClientSideValidationOnly
    • UseServerTypeParamForOlapConnections

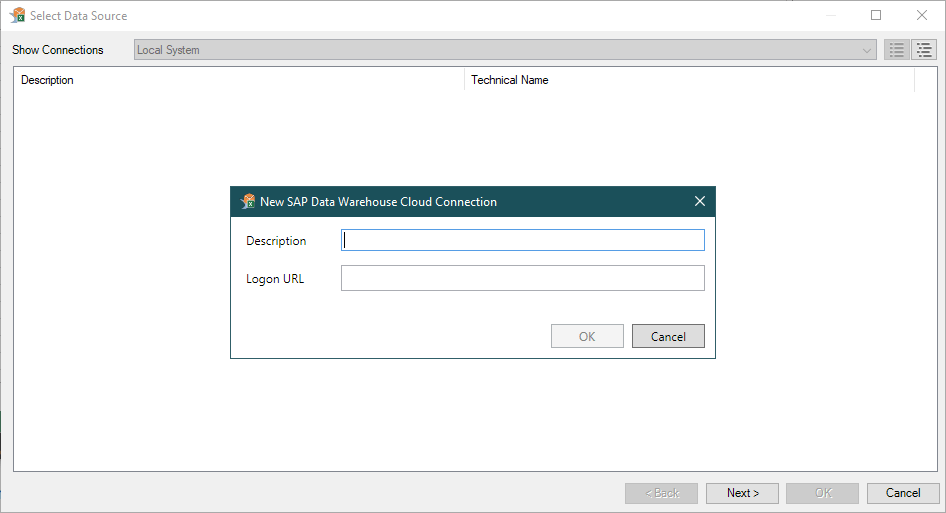
    But for me the best part is now the Data Warehouse Cloud connection. For this, you have to create a connection in the Insert Data Source dialog.

    Create Data Warehouse Cloud connection in Analysis for Office
    Create Data Warehouse Cloud connection in Analysis for Office

    There, you have to define a description and a logon URL to your Data Warehouse Cloud tenant. To logon, just double-click the created entry and enter your credentials.


    Now you get the typical Analysis office select data source dialog, and you can search for the analytical datasets of each space you are assigned to. You can search for the technical or business
    name of a view, and also for the space name. This is nice, but the Data Builder is still missing the folder or Info Area structure. So it can be a bit too much to scroll through the entire
    space if you have a lot of analytical data sets in it. By double click you can insert the crosstab and work like before in Analysis for Office

    Conclusion

    So this is the new function. And other than the SAP Analytics Cloud Addin for Microsoft Office, which has no really useful functions. You can now use the one and only Analysis for Office to
    analyze your data from the Data Warehouse Cloud (DWC). Maybe there will be sometimes also the relation data set available and not only the analytical ones.

    author.


    Hi,

    I am Tobias, I write this blog since 2014, you can find me on Twitter,
    LinkedInFacebook and YouTube. I work as a Senior Business Warehouse Consultant. In 2016, I wrote the first edition of . If you want, you can leave me a PayPal coffee donation. You can also contact me directly if you want.


  • Using SAP Datasphere bridge to convert SAP BW 7.4 objects

    Update 01/2025

    Name change from SAP Data Warehouse Cloud to SAP Datasphere. Some links may break.

    In this blog post, I want to share my experience with the Datasphere Bridge. There are several blogs out there that describe how to set up eclipse (https://www.seaparkconsultancy.com/single-post/create-a-dwc-sap-bw-bridge-project and https://blogs.sap.com/2022/01/24/using-sap-bw-bridge-for-data-warehouse-cloud-part-1-creating-simple-objects-demo/).
    So I won’t consider this, because there are other sources for this. I will focus on problems I had during the conversion from an SAP Business Warehouse 7.4 on any DB into Datasphere.

    So here is the configuration of my systems

    • SAP NetWeaver BW 7.4 on any DB SP19
    • Data Warehouse Cloud 2022.8.60


    First, I had a look into this blog post and look into the sap note 3141688. After I checked with the note analyzer, the notes that
    are missing in my system. I had a list of around 1,000 notes I had to implement.


    Okay, to be fair enough, the system release with BW 7.4 SP19 is from 2018 or so. So that normally should not happen in the real world. Now, after I implemented the notes over a long time and
    created several SAP tickets because of some wrong notes and not documented issues. I now can start with the steps of the blog post.


    Let’s get started and look into the system. Because our system is a demo system, I have no real data and also no InfoCubes and DSO I can convert. Let’s be honest, who created an InfoCube and a
    DSO in the last years? First, I had to think about how to create the objects in the SAP GUI 😉


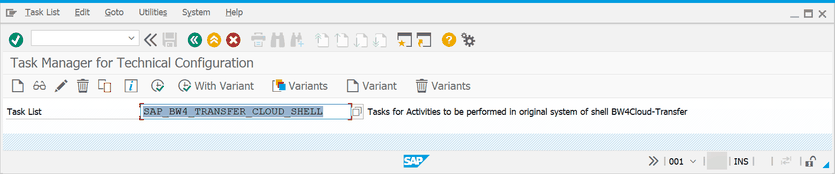
    But after I had created my first InfoCube for years, I can finally start. So let’s open the transaction code stc01 and select the task list
    SAP_BW4_TRANSFER_CLOUD_SHELL as described in the blog post above.


    SAP BW transaction stc01
    SAP BW transaction stc01

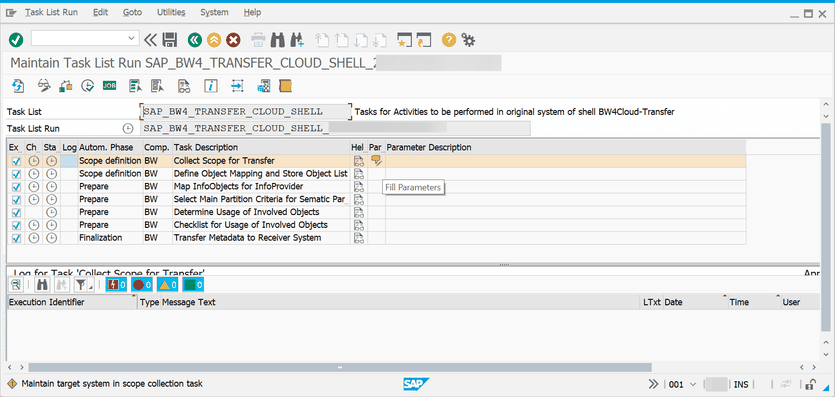
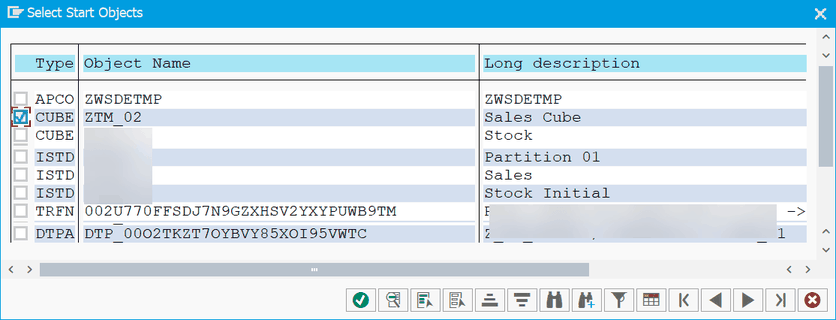
    Now we have to define the scope we want to transfer. Please keep in mind, that my test object is only an InfoCube with no Multiprovider or Query. In the scope definition, we can add our object.

    SAP BW Define scope for transfer
    SAP BW Define scope for transfer
    SAP BW Add new objects
    SAP BW Add new objects
    SAP BW Select object to convert
    SAP BW Select object to convert
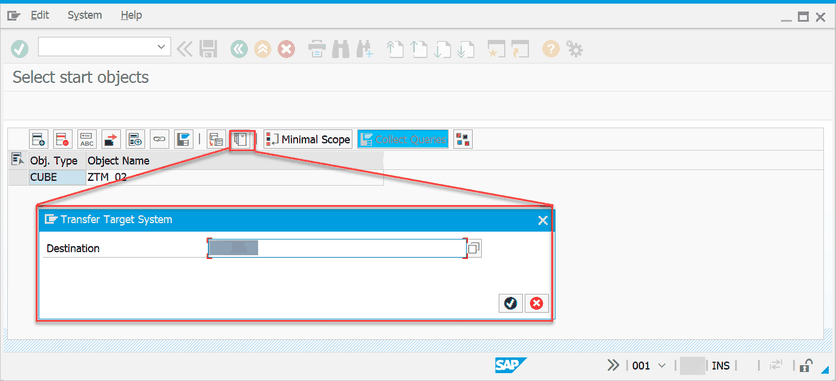
    SAP BW Define transfer system
    SAP BW Define transfer system

    Now we select the target system. We created the target system before in the transaction sm59 when we created our Eclipse BW Datasphere Project. Save the scope list. Then you will return to the
    task list. Now we can run the scope definition by clicking on Execute (F8).


    Here I had the first issue. You need a communication arrangement in the SAP Datasphere Bridge cockpit for SAP_COM_0691 SAP DWC BW Bridge – Migration Integration. Otherwise, the
    conversion would fail. I had a long discussion with the SAP support. I never found this anywhere.


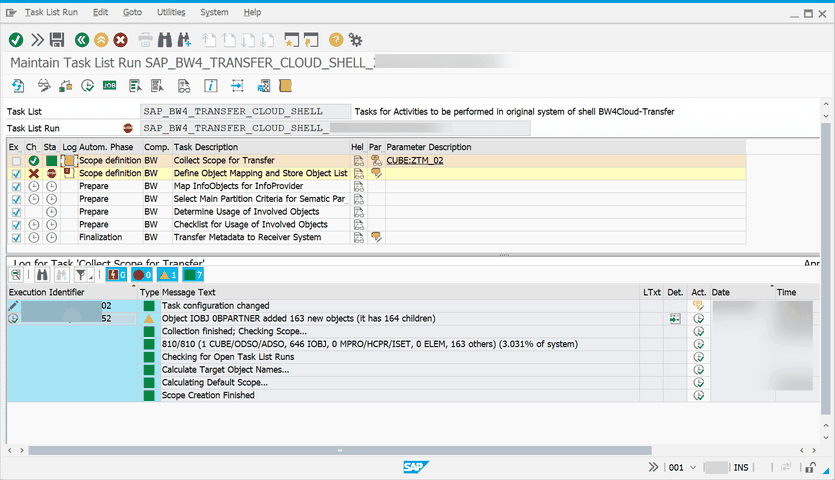
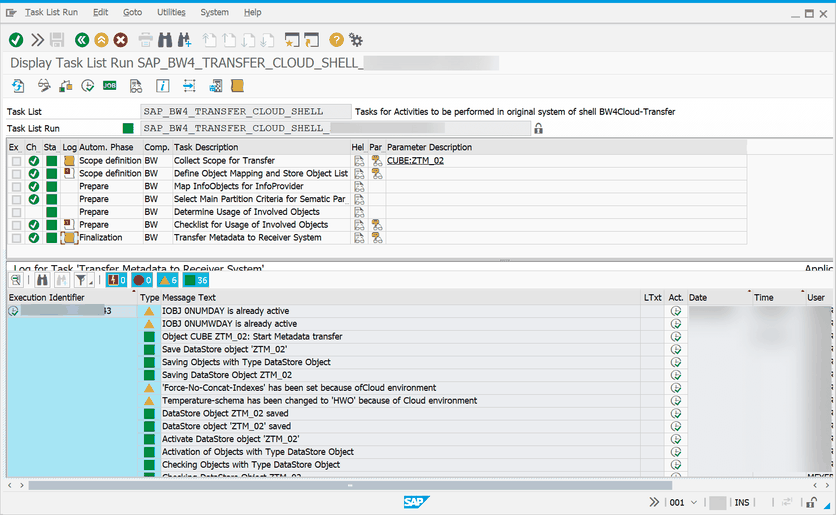
    Now we can run the scope. Here is the log.

    SAP BW Execute scope for transfer
    SAP BW Execute scope for transfer

    The task list automatically stops with the next steps. We have to define the mapping between the object and the transport request and package. Small hint here. The conversion user must be part of
    your transport request, otherwise there will be no transport request to select. To add it, open Eclipse and add the user in the transport request view to your desired transport. You can not
    create a transport request here. If you don’t have assigned one request, you can not process the next steps.

    SAP BW Add objects to transport request
    SAP BW Add objects to transport request
    SAP BW Execute mapping definition
    SAP BW Execute mapping definition

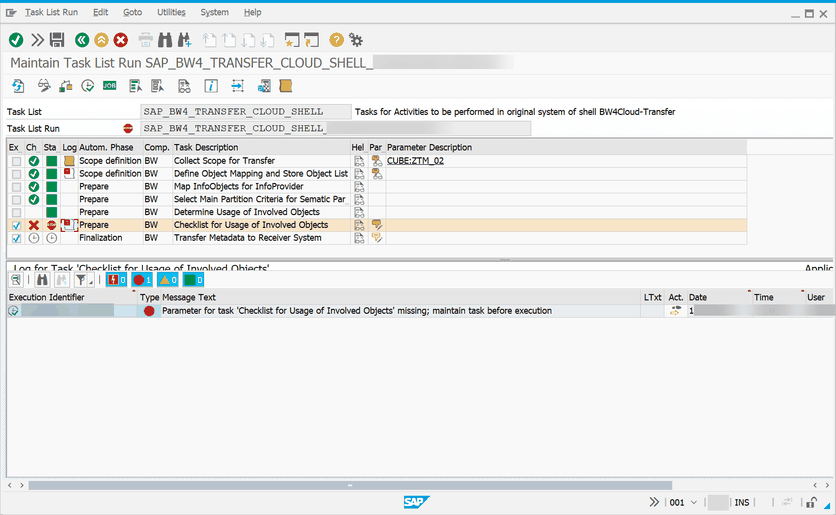
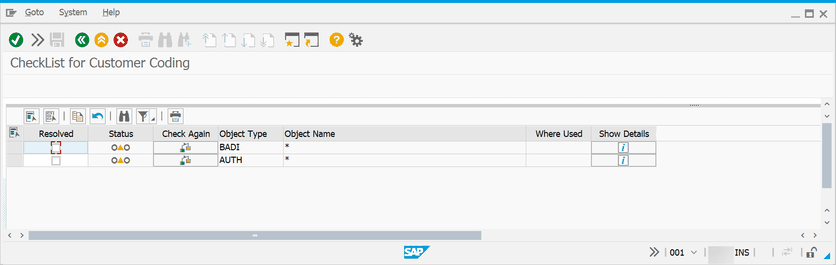
    Click on Save and go back to execute the mapping list. Now we stop at the preparation phase. There we have to confirm the BADI and AUTH are marked as resolved. In my case is no additional action
    required. Then go back and execute the task.


    SAP BW Check for customer coding
    SAP BW Check for customer coding

    Depending on how many objects you want to convert, choose either the dialog execution or schedule it as a job. Now the conversion is finished. We can look into the Datasphere to import the
    InfoCube as a remote table.


    SAP BW Conversion complete
    SAP BW Conversion complete

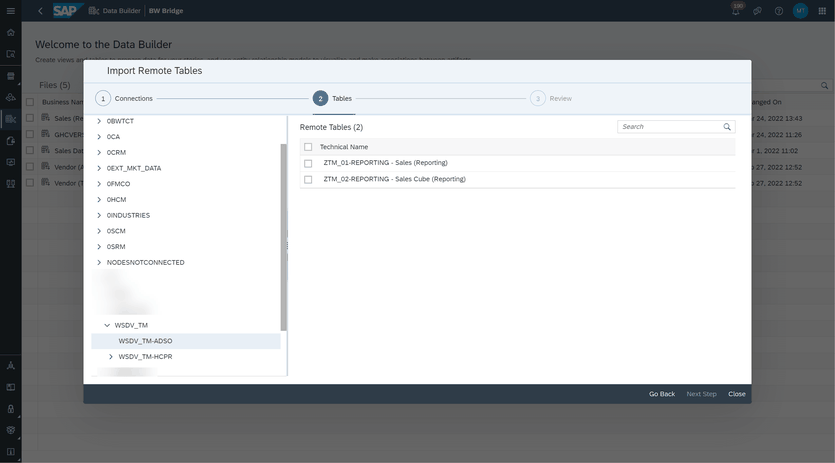
    Open the Datasphere and select the Data Builder with your BW Bridge Space. Click on Import Remote Tables to import your table.

    Datasphere Bridge Data Builder Import Remote Table
    Datasphere Bridge Data Builder Import Remote Table
    Datasphere select connection
    Datasphere select connection
    Datasphere Import remote table
    Datasphere Import remote table

    Select your desired InfoArea. There you find the table you can import. Select it and click on the button „Next Step“. Now you can give it a business and a technical name and click on import and
    deploy.


    The InfoCube from the BW 7.4 system is now available in the Datasphere through the DSP Bridge. You can share it with other Spaces and consume the data.

    Conclusion

    When you know what to do, it is straightforward. The conversion of an object from an old system into Datasphere via the bridge is similar to a conversion from SAP BW 7.x to BW/4HANA. The things
    which cost me a lot of time were the missing communication arrangement 691 and the transport request association. I hope this post will help someone use Datasphere with the bridge. If you have
    any questions, feel free to write them in the comments below.

    author.


    Hi,

    I am Tobias, I write this blog since 2014, you can find me on Twitter,
    LinkedInFacebook and YouTube. I work as a Senior Business Warehouse Consultant. In 2016, I wrote the first edition of . If you want, you can leave me a PayPal coffee donation. You can also contact me directly if you want.


  • Create a parent-child hierarchy in SAP Data Warehouse Cloud

    Update 01/2025

    Name change from SAP Data Warehouse Cloud to SAP Datasphere. Some links may break

    There are different ways to create hierarchies in Datasphere. One way is to use a CSV file and upload it into DSP. Another way is to use the existing hierarchies of your SAP BW system. In this
    post, I want to show how to use a hierarchy from BW and transform it into a parent-child hierarchy in Datasphere. After the transformation, we use the hierarchy in a view. 


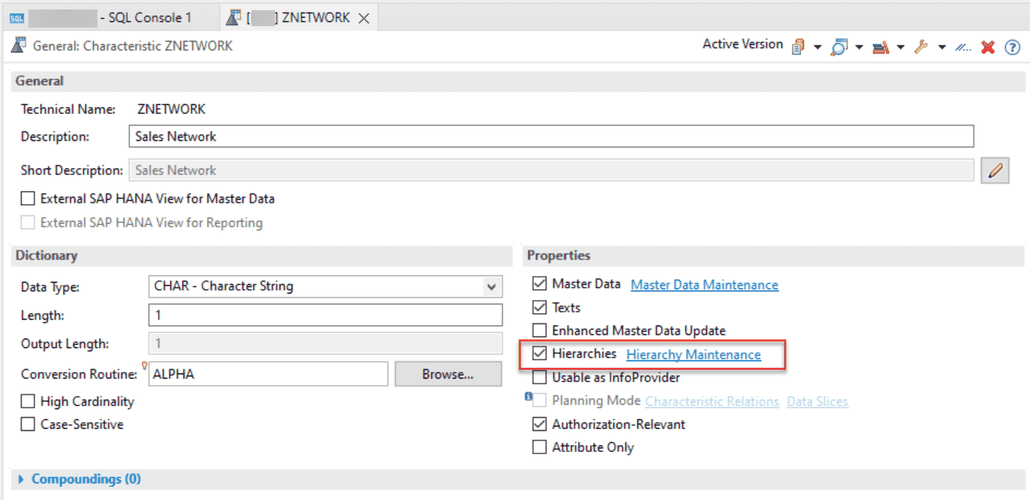
    First, we need a hierarchy on one InfoObject in SAP BW. 

    SAP BW InfoObject with hierarchy
    SAP BW InfoObject with hierarchy

    As we have now the hierarchy on the InfoObject, we can now transfer the H-Table as a remote table into Datasphere. For the transfer, we use the ABAP Connection and select under ABAP Tables the
    corresponding table. With click on next step, we can import and deploy the table.

    Import remote table into Datasphere
    Import remote table into Datasphere

    Now we have the H-Table in the Datasphere and can build an SQL View with a parent-child hierarchy. So let’s create a new SQL View in the Data Builder of the Datasphere.

    Create new SQL View in Datasphere
    Create new SQL View in Datasphere

    I created a SQL View. The statement select the node name as parent id and the node name as child id from my hierarchy table.


     select ( select "NODENAME" 
                from  "SPACE./BIC/HZNETWORK" as a 
               where a."NODEID" = b."PARENTID" ) as PARENTID,
            ( select "NODENAME"
                from "SPACE./BIC/HZNETWORK" as a 
               where a."NODEID" = b."NODEID" ) as CHILD_ID
     
       from "SPACE./BIC/HZNETWORK" as b


    The result looks like this

    Data preview in Datasphere
    Data preview in Datasphere

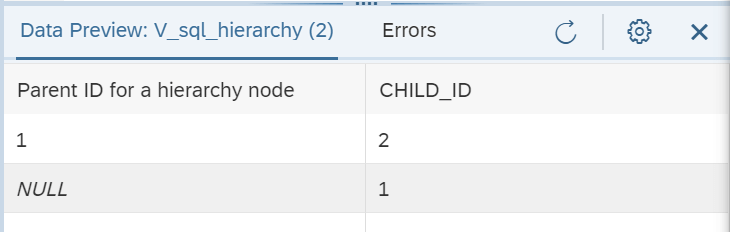
    As you see, the hierarchy node 1 has a child with the id 2. The BW view looks like this:

    Hierarchy in SAP BW
    Hierarchy in SAP BW

    Now we can use this view for an association with the dimension Sales Network (The InfoObject is ZNETWORK) (see figure 1) and use the dimension in the Sales View for filtering and navigation (see
    figure 2).

    Figure 1: Association hierarchy and dimension
    Figure 1: Association hierarchy and dimension
    Figure 2: Association dimension and view
    Figure 2: Association dimension and view

    In the SAP Analytics Cloud (SAC), the data looks like this:

    Output of example in SAC
    Output of example in SAC

    Conclusion

    This is just an example how you can create a parent-child hierarchy. SAP will offer such an option later when you look on the roadmap. I think this is an idea and if anyone has a better solution,
    please feel free to share it. One restriction has the parent-child hierarchy at the moment. There are no text nodes supported yet. Maybe it comes with the next releases of Datasphere. Feel free
    to share your thoughts on this idea in the comments.

    author.


    Hi,

    I am Tobias, I write this blog since 2014, you can find me on Twitter,
    LinkedInFacebook and YouTube. I work as a Senior Business Warehouse Consultant. In 2016, I wrote the first edition of . If you want, you can leave me a PayPal coffee donation. You can also contact me directly if you want.