reyemsaibot

SAP BI Blog about SAP BW/4HANA, Analysis for Office and SAP HANA - by Tobias Meyer

Blog

  • SAP BusinessObjects Design Studio 1.6 SP2

    The new Design Studio version will be released on 8th June. New features will be only available on BI platform, not on SAP NetWeaver. Here is a short Overview of the Roadmap.

    • End user
      • Waterfall Info Charts
      • Display scaling factors in Info Chart
      • Resizable, moveable dialogs
    • Analyst
      • Ad-hoc currency conversion
      • Build virtual hierarchy of stacked dimensions
      • Cascading Filter for Universe and CSV as Data Source
    • Designer, developer, admin
      • New standard components, e.g. Dialog, Filter Bar, Link, Multi-Line Text Input, Switch, Progress Bar (only in Fiori Library)
      • Info Chart Enhancements
      • Initial View Editor: Simple Calculations

    More information will be available on 8th June.

    author.


    I am Tobias, I write this blog since 2014, you can find me on twitter and youtube. If you want you can leave me a paypal coffee donation. You can also contact me directly if you want.


  • BEx Query Average vs. Excel Average

    When I was recently creating a new query at a customer, I have found a strange phenomenon. The query should show the average ticket number of a department. First you see the explanation and then
    I provide the solution of the problem.


    The query should show the individual, cumulative and average monthly values, as you can see in the screenshot.

    BEx Analyzer Average false values
    BEx Analyzer Average false values

    As you can see, there are no values for the months of May, June, August, November and December, so the cumulative values remain the same as the previous month.

    Unfortunately the calculation of the average has a problem, when a column has no value (for example May). In comparison the average value with the Excel formula AVERAGE.

    BEx Analyzer Average vs. Excel Average
    BEx Analyzer Average vs. Excel Average

    As you can see in the screenshot above, the key figures differ between the Excel formula and the result from the BEx Analyzer. According to the Excel formula the month of May has an average of
    43, according to the BEx Analyzer it has an average of 16. This is a large deviation. As you can see this error runs through all months after one column has no value.


    The interesting thing about the query is, if you have a department that has values from January to December, the average of the Bex Analyzer
    works without problems.

    BEx Analyzer Year Average vs. Excel Average
    BEx Analyzer Year Average vs. Excel Average

    The line Avg. no. tickets is identical to the line Excel formula AVG. That means the query definition is correct and working. But if there are months where no values have been
    posted, the average calculation of the BEx Analyzer failed.


    The following settings have been made to the key figures:


    No of tickets cumulated: the key figure is only cumulative, otherwise no further calculations.

    Selection Cumulated
    Selection Cumulated

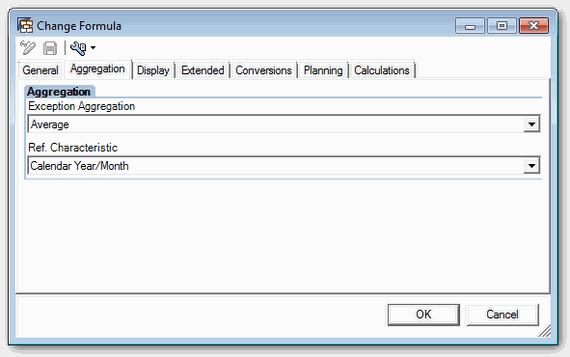
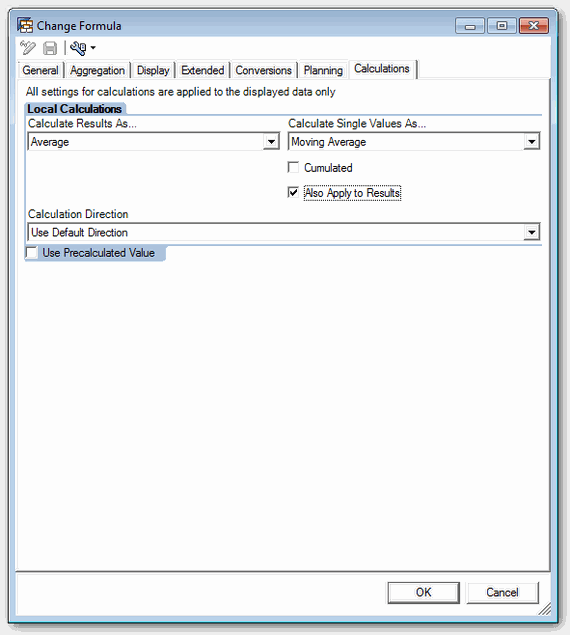
    Avg. no tickets: Aggregation on average with reference characteristic to Calendar Year/Month (0CALMONTH) and calculating the individual values and results as average or moving average.

    BEx Query Formula Aggregation
    BEx Query Formula Aggregation
    Bex Query Designer Formula Calculations
    Bex Query Designer Formula Calculations

    The question arises to me now is, why it works correctly when the entire year have posted values, but not when there are months without value. The cumulative value is also correctly calculated
    and doesn’t show an error. Only the average value is incorrect. Unfortunately, that was a problem for my client, since the report was intended of the controlling department and this department,
    you surely know, love Excel 😉


    So why the BEx Analyzer does interprets a blank line at cumulative values as 0, but failed if you want to calculate an average.


    So that the controlling department get the same result in the Bex Analyzer like with the Excel formula, we needed a solution. After a little research I found this SCN article, which says insert a new formula and add to this formula a 0. So nothing
    complicated, just a simple solution.

    BEx Analyzer Formula + 0
    BEx Analyzer Formula + 0

    As you can see on the screenshot below, the row Avg no of tickets + 0 has now another value than the row avg no of tickets. The cumulative value is identical.

    BEx Analyzer Average fixed with 0
    BEx Analyzer Average fixed with 0

    Now the comparison with the Excel formula AVERAGE:

    BEx Analyzer AVG + 0 and Excel AVG
    BEx Analyzer AVG + 0 and Excel AVG

    And as you can see now, the row avg. no of tickets + 0 and the row Excel formula AVG are identical. So I only have to hide the unnecessary rows and the query can be used. I hope
    this may help someone when you walk into the same issue. 😉

    author.


    I am Tobias, I write this blog since 2014, you can find me on twitter and youtube. If you want you can leave me a paypal coffee donation. You can also contact me directly if you want.

  • Analysis Office 2.3 features

    Here is a short overview about the new features of Analysis for Office 2.3

    • The Analysis for Office API has been extended. It is now possible to save data and to open workbooks.  So you are now
      able to open workbooks via VBA macro, as then with sapbex.xla!SAPBExReadWorkbook or
      BExAnalyzer.xla!runWorkbook .
    • It is now possible to cancel long-running queries
    • You can now rename dimensions, attributes and measures
    • There is now an option in the context menu of the components tab, which allows you to logoff from a BW system. This was previously only via VBA API possible. According to this SCN thread it isn’t the identical as
      in Bex Analyzer 3.5/7.0 because you have to replace the system and then reconnect to another system.
    • It is now possible to add filter values via upload of a text file. I believe it was already in Analysis for Office 2.2 SP3
      available. I will create a detailed post soon.
    • You can create restricted measures on the fly in Analysis for Office, but you need BW 7.5 SP4 to do this
    • The sheet protection is provided for the next release in Q4
    • There is a new report type in the transaction RSBBS called „Analysis Office“ available, which allows
      you to jump from Design Studio into an Analysis for Office workbook.
    • There is also a new Table Design Rule Editor.

    I think there is some cool new stuff in SAP Analysis for Office 2.3 available. Can’t wait to see the next version.

    author.


    I am Tobias, I write this blog since 2014, you can find me on twitter and youtube. If you want you can leave me a paypal coffee donation. You can also contact me directly if you want.

  • Analysis Office 2.3 is available

    Since yesterday Analysis for Office 2.3 is available. You can download it here, to download it you need a S-User with download
    credentials.


    The admin and user guide isn’t available at the moment. I hope SAP will release it in the next days. First
    impressions can be made at this SCN article from Tammy Powlas.


    I just download the version and hope to write more in the next days.

    author.


    I am Tobias, I write this blog since 2014, you can find me on twitter and youtube. If you want you can leave me a paypal coffee donation. You can also contact me directly if you want.
  • Analysis Office Save Query View

    As in the BEx Analyzer you can save also query views in Analysis for Office.
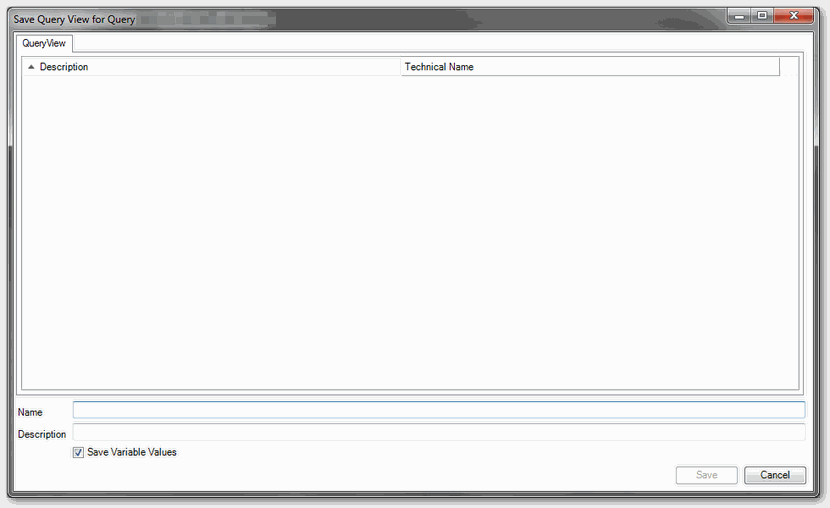
    Currently in version 2.2 SP2 you can find this option under Tools >> Save View.

    SAP Analysis for Office Save Query View
    SAP Analysis for Office Save Query View

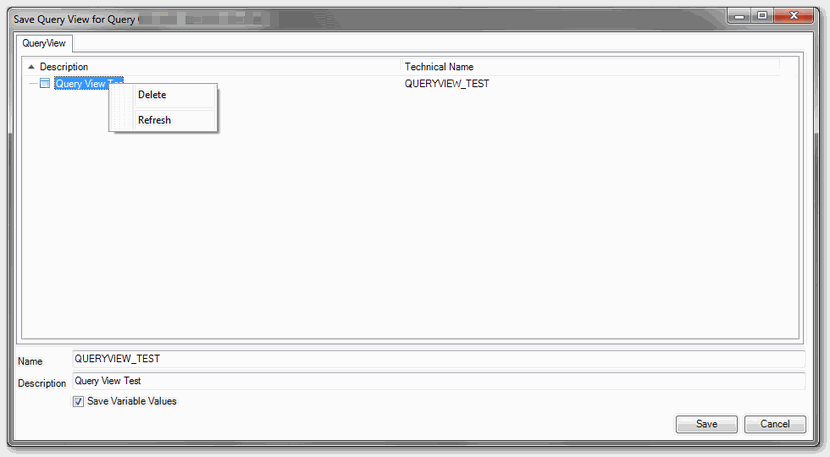
    The name field is the technical name of the View. There are no spaces are allowed. If the option „Save Variables Values“ is active, the values are saved together with the query view. The
    query view is saved on the same server as the DataSource.


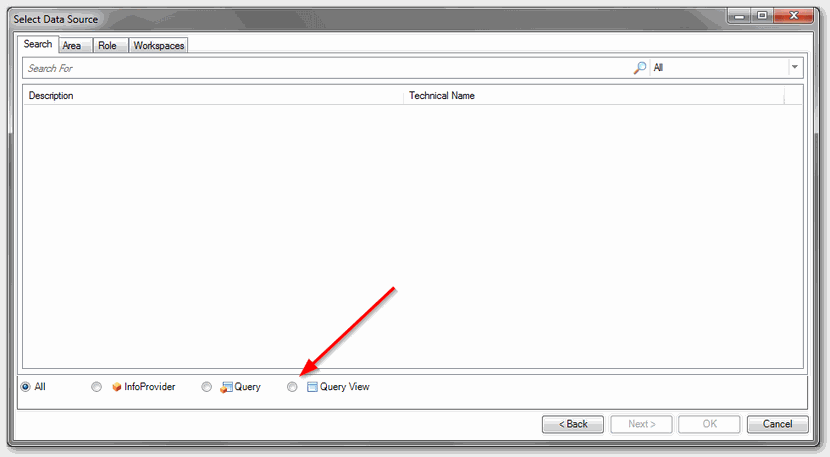
    You can open the query view with the Icon „Insert DataSource„. Select the item „Select Data Souce…“ and then select the option „Query View“ in the search. Now you can
    search for your query view.

    SAP Analysis for Office Insert Data Source
    SAP Analysis for Office Insert Data Source
    SAP Analysis for Office Select Data Source
    SAP Analysis for Office Select Data Source

    To delete a query view you have to use the context menu in the save query view dialog. The system checks if the view is used in another workbook on the same server. If the query view is used in
    an object that is stored on another server, no message appears.

    SAP Analysis for Office Delete Query View
    SAP Analysis for Office Delete Query View

    author.


    I am Tobias, I write this blog since 2014, you can find me on twitter and youtube. If you want you can leave me a paypal coffee donation. You can also contact me directly if you want.
  • Analysis Office Data Analysis Advanced Calculations

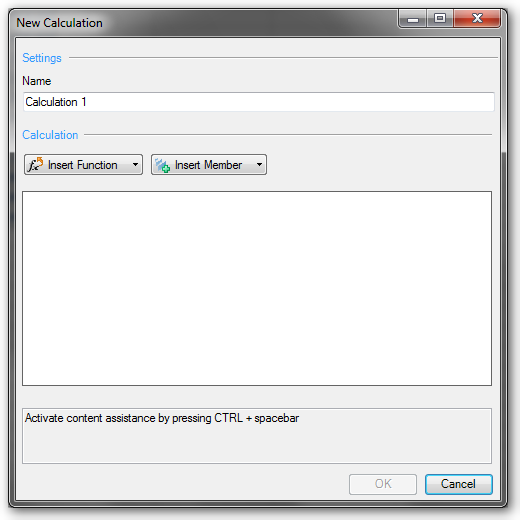
    Since Analysis Office 2.1 you have a formula editor. You can find this function in the group Data Analysis >>
    Calculations >> Add Advanced Calculation.

    Analysis Office Add new advanced calculation
    Analysis Office Add new advanced calculation

    With this function you can create complex calculations, as you could make earlier in a BEx Query. You can find mathematical functions, data
    functions, percentage functions and Boolean operators.


    Besides addition and subtraction, you can find functions like logarithm to the base of 10 or decimal part of operand.


    In the data functions you will find something like „value without dimension“ or „NOERR(X): Equals 0 for undefined calculations; otherwise x“ or „NDIV0(x): Equals 0 When Divided by 0; otherwise x.
    The Boolean operators are found such functions as „AND“ or „EXCLUSIVE OR“


    I think the new calculations are great, I haven’t longer to overfill the single query with dozens of calculations and I only need to build the calculations in the Workbook where I needed them.
    But this is the greatest disadvantage too. When I need some calculations often, I have to create them each time.


    Nevertheless, I am a friend of simple queries, because they are most immediately understandable.

    author.


    Hi,

    I am Tobias, I write this blog since 2014, you can find me on twitterfacebook and youtube. I work as a Senior Business
    Warehouse Consultant. In 2016 I wrote the first edition of . If you want you can leave me a paypal coffee
    donation. You can also contact me directly if you want.


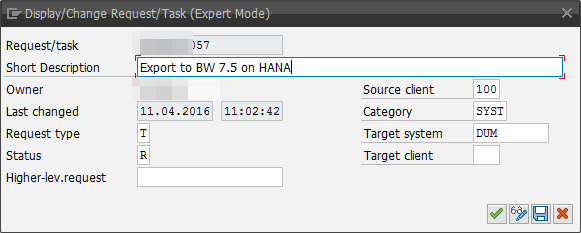
  • Change Requests after release

    1. Open transaction se38
    2. Open program RDDIT076
    3. Execute (F8)
    4. Enter a request or task number
    5. Execute (F8)
    6. Doubleclick on a selected entry
    7. Switch between Display and Change (F9)
    8. Change your request
    9. Save (CTRL + S)
    Change request after release
    Change request after release

    author.


    I am Tobias, I write this blog since 2014, you can find me on twitter and youtube. If you want you can leave me a paypal coffee donation. You can also contact me directly if you want.

  • SAP BW Change process type of process chain

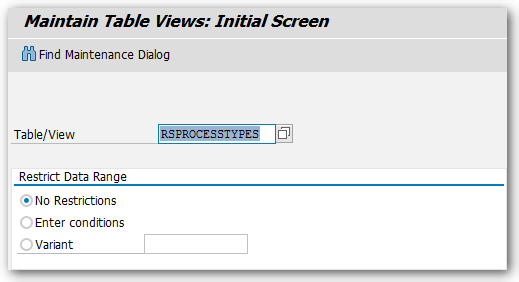
    • Call transaction sm30
    • Open Table/View RSPROCESSTYPES
    Maintain Table Views RSPROCESSTYPES
    Maintain Table Views RSPROCESSTYPES
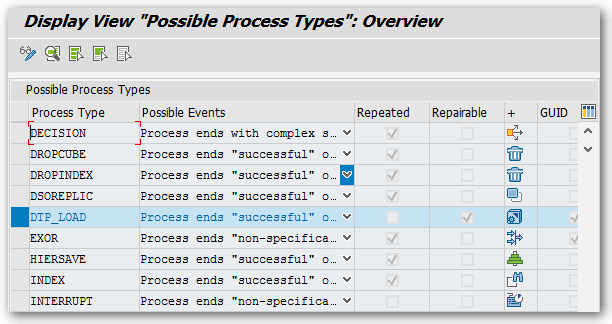
    • Display entries
    • Select Process Type for example „DTP_LOAD“
    DTP_LOAD Process Type
    DTP_LOAD Process Type

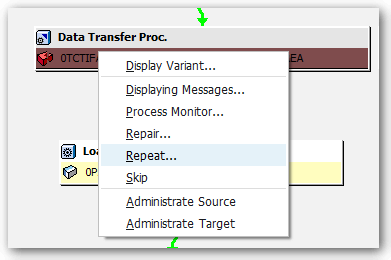
    Now you can see, that the process type DTP_LOAD is repairable but not repeated. If you want to change this option, you have to select „Display -> Change“ (CTRL + F1)

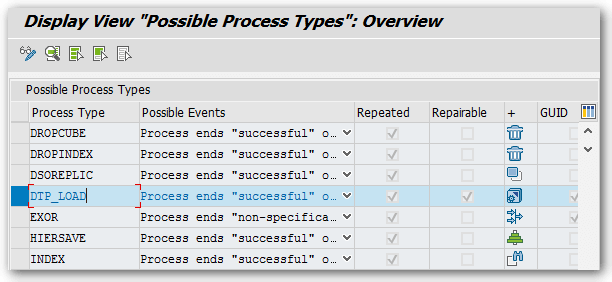
    DTP_LOAD changed
    DTP_LOAD changed

    Now you can see the process type can be repeated as well.


    Before option was changed. No repeat available.

    After option was changed. Now you can repeat a DTP.


    author.


    I am Tobias, I write this blog since 2014, you can find me on twitter and youtube. If you want you can leave me a paypal coffee donation. You can also contact me directly if you want.

  • SAP Analysis Office Logoff via VBA

    After SAP still doesn’t provide a native button in Analysis for Office 2.2 SP2 to log off from a system, I decided to
    make a short instruction from my article „Analysis for Office 2.1 Logoff via VBA„. Have fun.

    author.


    I am Tobias, I write this blog since 2014, you can find me on twitter and youtube. If you want you can leave me a paypal coffee donation. You can also contact me directly if you want.
  • Design Studio Install Extension on BI Platform

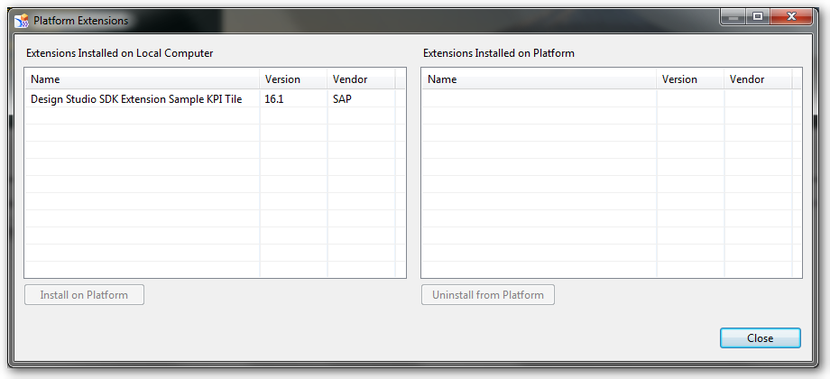
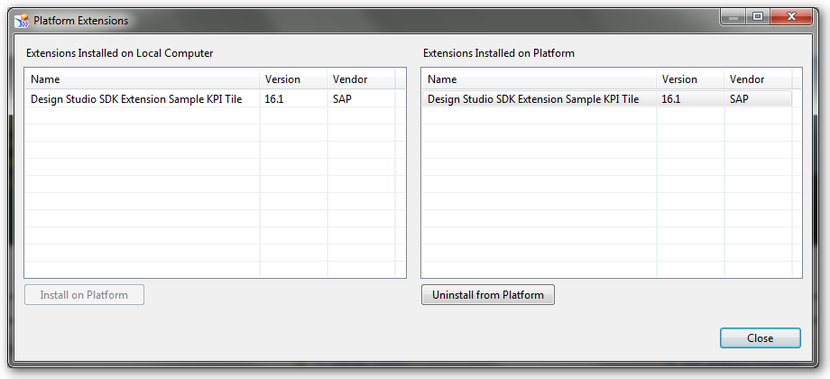
    If you have developed your own extension with the SAP Design Studio SDK and want to publish this extension on the BI Platform, you have to click on Help >> Platform Extensions.


    Now you see the following screen.

    Platform Extensions
    Platform Extensions

    Select your lokal installed extension and click the Button „Install on Platform“.


    Note: Only BI Platform Administrators or BI Platform Design Studio Administrators have the rights to install an extension.


    Should your user not belong to any of these groups, ask your BI Platform Administrator to add you in one of these groups. After your BI Platform Administrator added you to one group, you don’t
    need to restart the Design Studio.


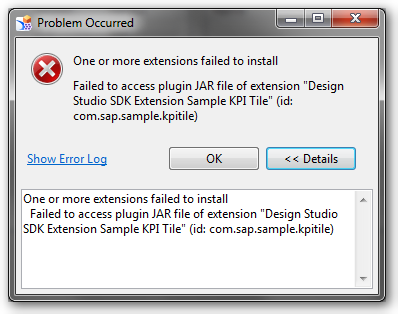
    Maybe the installation of the extension throws an error like this „One or more extensions failed to install. Failed to access plugin JAR file of extension „Design Studio SDK Extension Sample KPI
    Tile“. Unfortunately the Details-Button show no more information.

    Design Studio Platform Extension Problem
    Design Studio Platform Extension Problem

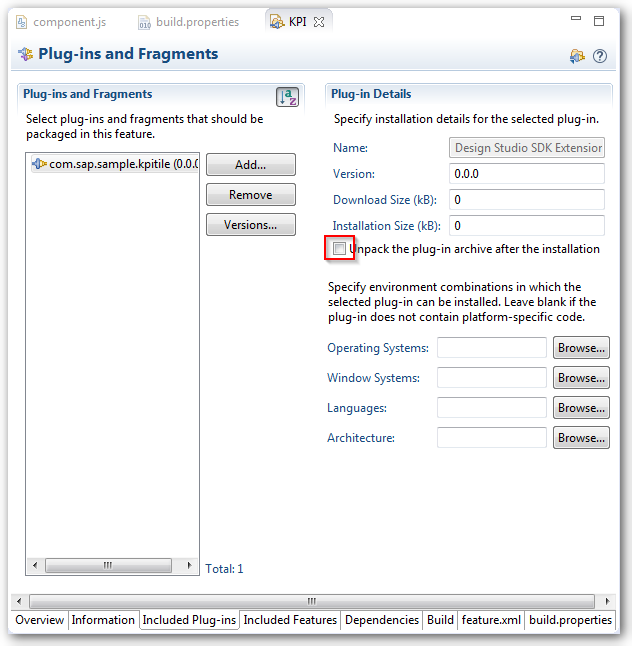
    This error appears, when the *.jar file in the folder C:users<username>Analysis-configplugins is missing. Thus the extension can’t upload to the BI Platform. This error was the result
    of the checkbox „Unpack the plugin-archive after installation“ from the file feature.xml in Eclipse. (More information look in the Developer Guide Point 3.3.2)

    Plugin Development Eclipse
    Plugin Development Eclipse

    After you fix this, you have to uninstall the extension and possibly delete the above mentioned folder content and install the extension again. After this the upload to the BI Platform should
    work.

    Design Studio Platform Extension
    Design Studio Platform Extension

    author.


    I am Tobias, I write this blog since 2014, you can find me on twitter and youtube. If you want you can leave me a paypal coffee donation. You can also contact me directly if you want.