staging.tobiasmeyer.net

Schlagwort: sapbw

  • Analysis for Office 2.8 SP14 is available

    Unfortunately, I didn’t make it to publish the post in the last month. There were several reasons that I didn’t make it, like the internal BI days or to prepare the next deep dive for Data
    Warehouse Cloud. But back to topic. SAP published Analysis for Office 2.8 SP14. Maybe there is something with the SP14 because Analysis Office 1.4 had also a SP14 before Analysis office 2.0 was
    released. So perhaps we see some new feature in the future?


    But back to Analysis for Office 2.8 SP14. Now you are able to connect to Data warehouse Cloud and consume the analytical data sets directly in Excel. This is the biggest update with for a long
    time with features. The last updates were mostly bug fixing and some technical setting parameter, but nothing what is fascinating.


    Besides the function in Analysis Office 2.8 SP12 repeat titles of a crosstab. The latest version also offers a new API method called SaveBwComments and some new technical settings like

    • AllowFlatPresentationForHierarchyNodeVariables
    • SapGetDataClientSideValidationOnly
    • UseServerTypeParamForOlapConnections

    But for me the best part is now the Data Warehouse Cloud connection. For this, you have to create a connection in the Insert Data Source dialog.
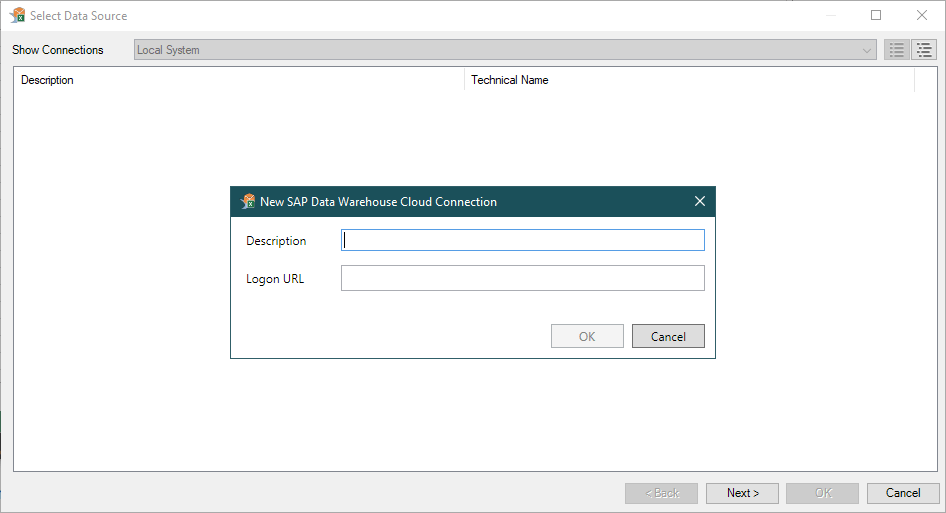
    Create Data Warehouse Cloud connection in Analysis for Office
    Create Data Warehouse Cloud connection in Analysis for Office

    There, you have to define a description and a logon URL to your Data Warehouse Cloud tenant. To logon, just double-click the created entry and enter your credentials.


    Now you get the typical Analysis office select data source dialog, and you can search for the analytical datasets of each space you are assigned to. You can search for the technical or business
    name of a view, and also for the space name. This is nice, but the Data Builder is still missing the folder or Info Area structure. So it can be a bit too much to scroll through the entire
    space if you have a lot of analytical data sets in it. By double click you can insert the crosstab and work like before in Analysis for Office

    Conclusion

    So this is the new function. And other than the SAP Analytics Cloud Addin for Microsoft Office, which has no really useful functions. You can now use the one and only Analysis for Office to
    analyze your data from the Data Warehouse Cloud (DWC). Maybe there will be sometimes also the relation data set available and not only the analytical ones.

    author.


    Hi,

    I am Tobias, I write this blog since 2014, you can find me on Twitter,
    LinkedInFacebook and YouTube. I work as a Senior Business Warehouse Consultant. In 2016, I wrote the first edition of Analysis Office – The Comprehensive Guide. If you want, you can leave me a PayPal coffee donation. You can also contact me directly if you want.


    Subscribe


    • In my newsletter, you get informed about new topics
    • You learn how to use Analysis Office
    • You get tips and tricks about SAP BI topics
    • You get the first 3 chapters of my e-book Analysis Office – The Comprehensive Guide for free
    /**/

    * indicates required

    You want to know SAP Analysis Office in a perfect detail?
    You want to know how to build an Excel Dashboard with your Query in Analysis Office? 
    You want to know how functions in SAP Analysis Office works?


    Then you have to take a look into Analysis Office  – The Comprehensive Guide. Either as a video course or as an e-book.

  • Using SAP Datasphere bridge to convert SAP BW 7.4 objects

    Update 01/2025

    Name change from SAP Data Warehouse Cloud to SAP Datasphere. Some links may break.

    In this blog post, I want to share my experience with the Datasphere Bridge. There are several blogs out there that describe how to set up eclipse (https://www.seaparkconsultancy.com/single-post/create-a-dwc-sap-bw-bridge-project and https://blogs.sap.com/2022/01/24/using-sap-bw-bridge-for-data-warehouse-cloud-part-1-creating-simple-objects-demo/).
    So I won’t consider this, because there are other sources for this. I will focus on problems I had during the conversion from an SAP Business Warehouse 7.4 on any DB into Datasphere.

    So here is the configuration of my systems

    • SAP NetWeaver BW 7.4 on any DB SP19
    • Data Warehouse Cloud 2022.8.60


    First, I had a look into this blog post and look into the sap note 3141688. After I checked with the note analyzer, the notes that
    are missing in my system. I had a list of around 1,000 notes I had to implement.


    Okay, to be fair enough, the system release with BW 7.4 SP19 is from 2018 or so. So that normally should not happen in the real world. Now, after I implemented the notes over a long time and
    created several SAP tickets because of some wrong notes and not documented issues. I now can start with the steps of the blog post.


    Let’s get started and look into the system. Because our system is a demo system, I have no real data and also no InfoCubes and DSO I can convert. Let’s be honest, who created an InfoCube and a
    DSO in the last years? First, I had to think about how to create the objects in the SAP GUI 😉


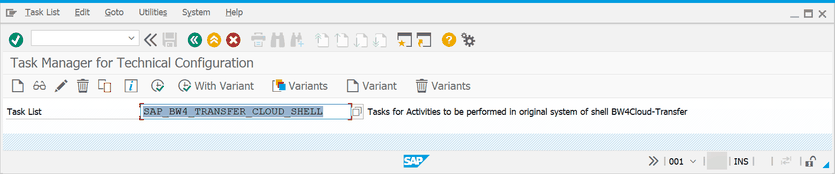
    But after I had created my first InfoCube for years, I can finally start. So let’s open the transaction code stc01 and select the task list
    SAP_BW4_TRANSFER_CLOUD_SHELL as described in the blog post above.


    SAP BW transaction stc01
    SAP BW transaction stc01

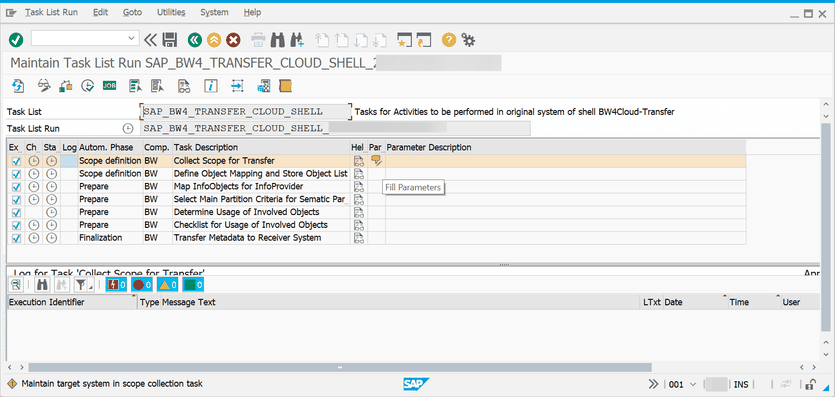
    Now we have to define the scope we want to transfer. Please keep in mind, that my test object is only an InfoCube with no Multiprovider or Query. In the scope definition, we can add our object.

    SAP BW Define scope for transfer
    SAP BW Define scope for transfer
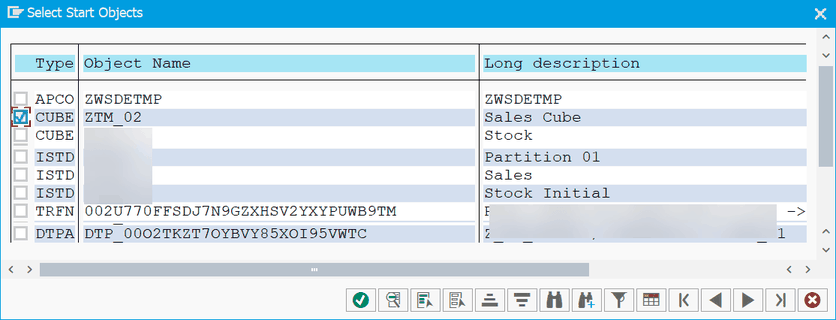
    SAP BW Add new objects
    SAP BW Add new objects
    SAP BW Select object to convert
    SAP BW Select object to convert
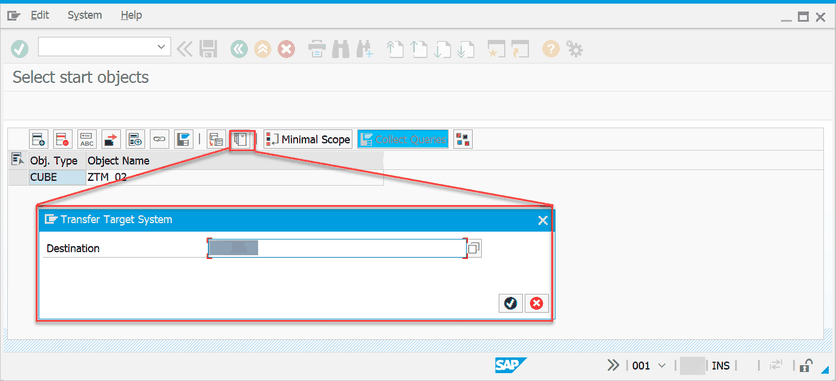
    SAP BW Define transfer system
    SAP BW Define transfer system

    Now we select the target system. We created the target system before in the transaction sm59 when we created our Eclipse BW Datasphere Project. Save the scope list. Then you will return to the
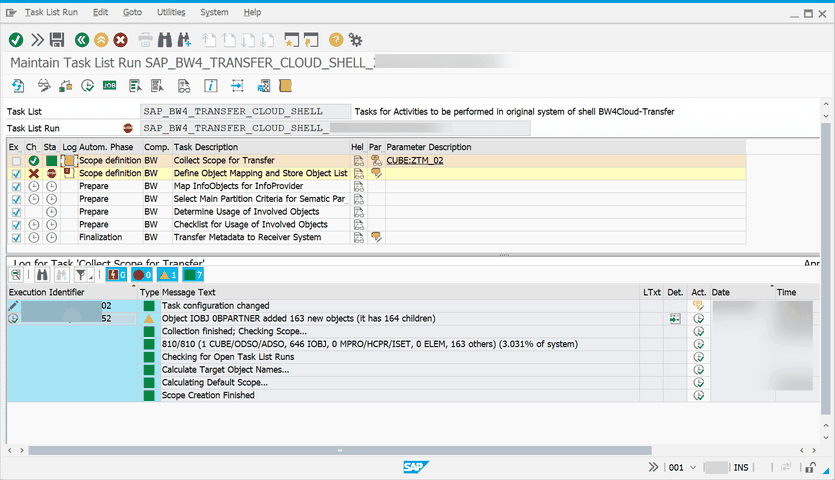
    task list. Now we can run the scope definition by clicking on Execute (F8).


    Here I had the first issue. You need a communication arrangement in the SAP Datasphere Bridge cockpit for SAP_COM_0691 SAP DWC BW Bridge – Migration Integration. Otherwise, the
    conversion would fail. I had a long discussion with the SAP support. I never found this anywhere.


    Now we can run the scope. Here is the log.

    SAP BW Execute scope for transfer
    SAP BW Execute scope for transfer

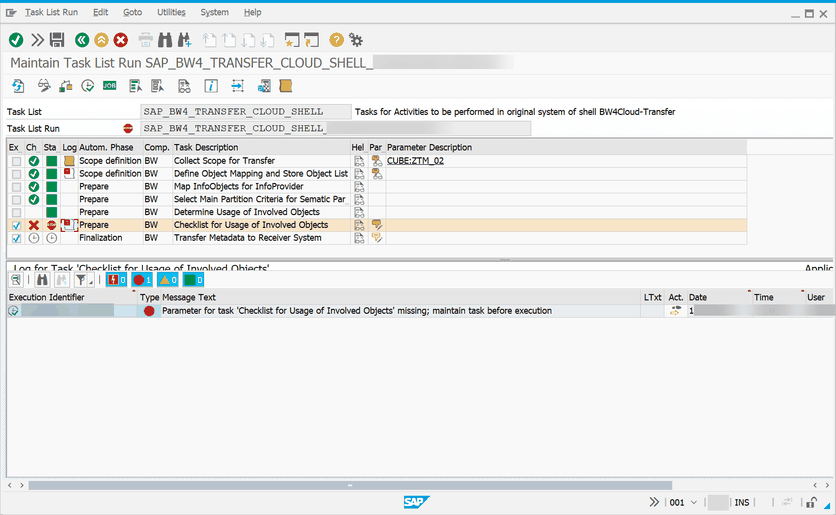
    The task list automatically stops with the next steps. We have to define the mapping between the object and the transport request and package. Small hint here. The conversion user must be part of
    your transport request, otherwise there will be no transport request to select. To add it, open Eclipse and add the user in the transport request view to your desired transport. You can not
    create a transport request here. If you don’t have assigned one request, you can not process the next steps.

    SAP BW Add objects to transport request
    SAP BW Add objects to transport request
    SAP BW Execute mapping definition
    SAP BW Execute mapping definition

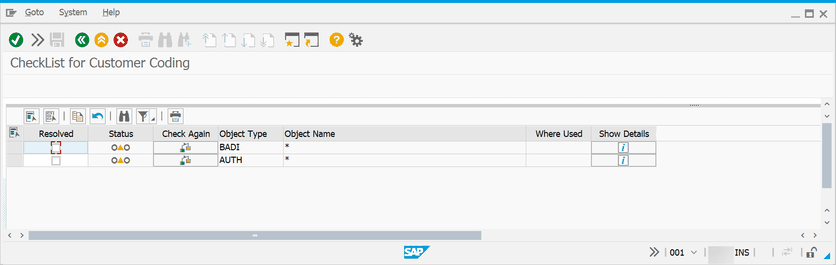
    Click on Save and go back to execute the mapping list. Now we stop at the preparation phase. There we have to confirm the BADI and AUTH are marked as resolved. In my case is no additional action
    required. Then go back and execute the task.


    SAP BW Check for customer coding
    SAP BW Check for customer coding

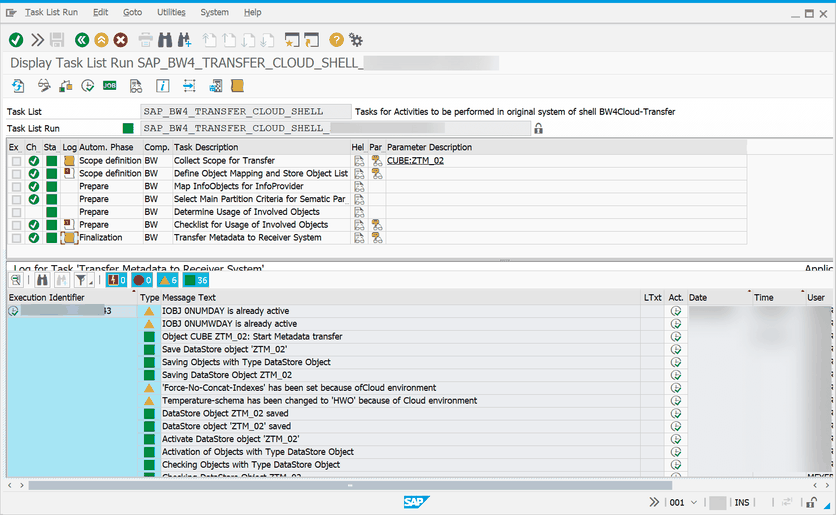
    Depending on how many objects you want to convert, choose either the dialog execution or schedule it as a job. Now the conversion is finished. We can look into the Datasphere to import the
    InfoCube as a remote table.


    SAP BW Conversion complete
    SAP BW Conversion complete

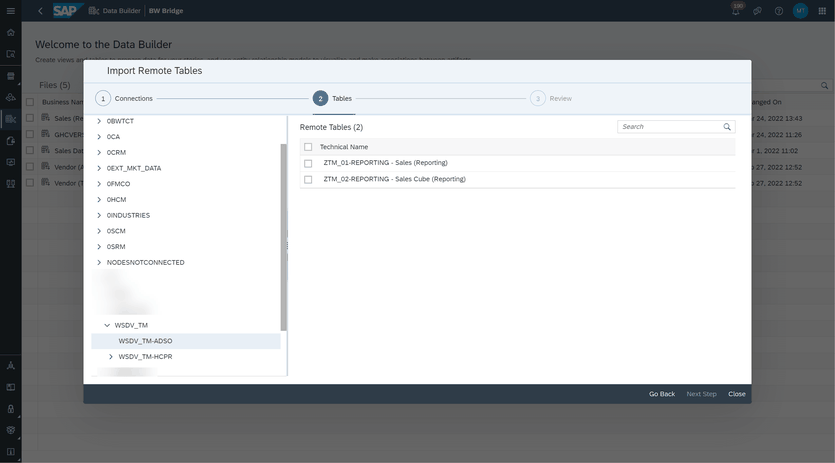
    Open the Datasphere and select the Data Builder with your BW Bridge Space. Click on Import Remote Tables to import your table.

    Datasphere Bridge Data Builder Import Remote Table
    Datasphere Bridge Data Builder Import Remote Table
    Datasphere select connection
    Datasphere select connection
    Datasphere Import remote table
    Datasphere Import remote table

    Select your desired InfoArea. There you find the table you can import. Select it and click on the button „Next Step“. Now you can give it a business and a technical name and click on import and
    deploy.


    The InfoCube from the BW 7.4 system is now available in the Datasphere through the DSP Bridge. You can share it with other Spaces and consume the data.

    Conclusion

    When you know what to do, it is straightforward. The conversion of an object from an old system into Datasphere via the bridge is similar to a conversion from SAP BW 7.x to BW/4HANA. The things
    which cost me a lot of time were the missing communication arrangement 691 and the transport request association. I hope this post will help someone use Datasphere with the bridge. If you have
    any questions, feel free to write them in the comments below.

    author.


    Hi,

    I am Tobias, I write this blog since 2014, you can find me on Twitter,
    LinkedInFacebook and YouTube. I work as a Senior Business Warehouse Consultant. In 2016, I wrote the first edition of Analysis Office – The Comprehensive Guide. If you want, you can leave me a PayPal coffee donation. You can also contact me directly if you want.


    Subscribe


    • In my newsletter, you get informed about new topics
    • You learn how to use Analysis Office
    • You get tips and tricks about SAP BI topics
    • You get the first 3 chapters of my e-book Analysis Office – The Comprehensive Guide for free
    /**/

    * indicates required

    You want to know SAP Analysis Office in a perfect detail?
    You want to know how to build an Excel Dashboard with your Query in Analysis Office? 
    You want to know how functions in SAP Analysis Office works?


    Then you have to take a look into Analysis Office  – The Comprehensive Guide. Either as a video course or as an e-book.

  • Create a parent-child hierarchy in SAP Data Warehouse Cloud

    Update 01/2025

    Name change from SAP Data Warehouse Cloud to SAP Datasphere. Some links may break

    There are different ways to create hierarchies in Datasphere. One way is to use a CSV file and upload it into DSP. Another way is to use the existing hierarchies of your SAP BW system. In this
    post, I want to show how to use a hierarchy from BW and transform it into a parent-child hierarchy in Datasphere. After the transformation, we use the hierarchy in a view. 


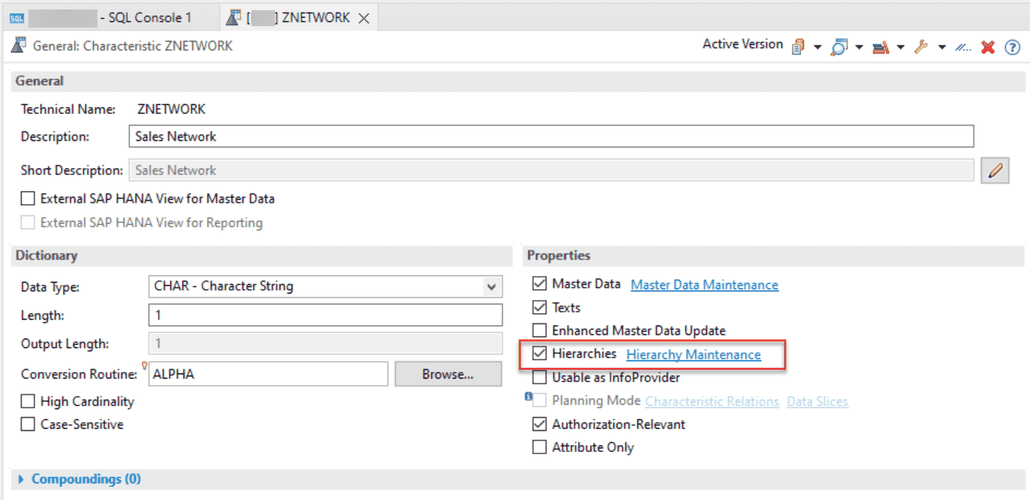
    First, we need a hierarchy on one InfoObject in SAP BW. 

    SAP BW InfoObject with hierarchy
    SAP BW InfoObject with hierarchy

    As we have now the hierarchy on the InfoObject, we can now transfer the H-Table as a remote table into Datasphere. For the transfer, we use the ABAP Connection and select under ABAP Tables the
    corresponding table. With click on next step, we can import and deploy the table.

    Import remote table into Datasphere
    Import remote table into Datasphere

    Now we have the H-Table in the Datasphere and can build an SQL View with a parent-child hierarchy. So let’s create a new SQL View in the Data Builder of the Datasphere.

    Create new SQL View in Datasphere
    Create new SQL View in Datasphere

    I created a SQL View. The statement select the node name as parent id and the node name as child id from my hierarchy table.


     select ( select "NODENAME" 
                from  "SPACE./BIC/HZNETWORK" as a 
               where a."NODEID" = b."PARENTID" ) as PARENTID,
            ( select "NODENAME"
                from "SPACE./BIC/HZNETWORK" as a 
               where a."NODEID" = b."NODEID" ) as CHILD_ID
     
       from "SPACE./BIC/HZNETWORK" as b


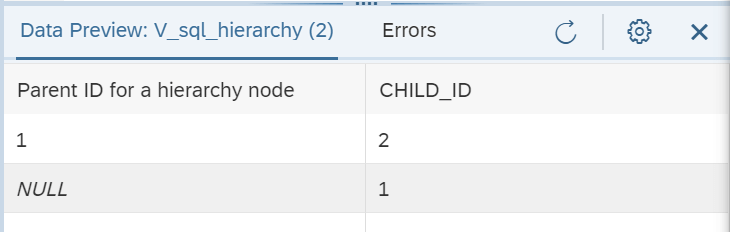
    The result looks like this

    Data preview in Datasphere
    Data preview in Datasphere

    As you see, the hierarchy node 1 has a child with the id 2. The BW view looks like this:

    Hierarchy in SAP BW
    Hierarchy in SAP BW

    Now we can use this view for an association with the dimension Sales Network (The InfoObject is ZNETWORK) (see figure 1) and use the dimension in the Sales View for filtering and navigation (see
    figure 2).

    Figure 1: Association hierarchy and dimension
    Figure 1: Association hierarchy and dimension
    Figure 2: Association dimension and view
    Figure 2: Association dimension and view

    In the SAP Analytics Cloud (SAC), the data looks like this:

    Output of example in SAC
    Output of example in SAC

    Conclusion

    This is just an example how you can create a parent-child hierarchy. SAP will offer such an option later when you look on the roadmap. I think this is an idea and if anyone has a better solution,
    please feel free to share it. One restriction has the parent-child hierarchy at the moment. There are no text nodes supported yet. Maybe it comes with the next releases of Datasphere. Feel free
    to share your thoughts on this idea in the comments.

    author.


    Hi,

    I am Tobias, I write this blog since 2014, you can find me on Twitter,
    LinkedInFacebook and YouTube. I work as a Senior Business Warehouse Consultant. In 2016, I wrote the first edition of Analysis Office – The Comprehensive Guide. If you want, you can leave me a PayPal coffee donation. You can also contact me directly if you want.


    Subscribe


    • In my newsletter, you get informed about new topics
    • You learn how to use Analysis Office
    • You get tips and tricks about SAP BI topics
    • You get the first 3 chapters of my e-book Analysis Office – The Comprehensive Guide for free
    /**/

    * indicates required

    You want to know SAP Analysis Office in a perfect detail?
    You want to know how to build an Excel Dashboard with your Query in Analysis Office? 
    You want to know how functions in SAP Analysis Office works?


    Then you have to take a look into Analysis Office  – The Comprehensive Guide. Either as a video course or as an e-book.


  • Comparing of data flows through SAP Landscape

    It is quite a while since I published my last post. A lot happened since then. Analysis for Office 2.8 SP10 is now available, the summer and the vacation  are over. But in the meantime
    I developed some new ABAP tools, had quite some interesting exchange and took the SQL Script course by Jörg
    Brandeis
    . But in this blog post I want to share with you the latest tool I developed which compare transformations in SAP Business Warehouse systems through the landscape.


    Here is a short overview:

    The tool allows you to compare and check the following information:

    • Global Transformation Information
    • Global Routine
    • Field, Start, End and Expert routine
    • Mapping
    • Constants
    • Data Transfer Process Information
    • Data Transfer Process Filter (Fields and Coding)
    • Data Transfer Process Semantic Groups

    So you see on the first sight if something is different between your SAP landscape. You can also see on which transports are your transformation was and how the import status is.

    Conclusion

    This tool allows you to reduce the maintenance in your SAP landscape and display directly the differences. You can either start with a specific transformation or with a source or target, which
    means the complete data flow will be analyzed. If you have any ideas to extend this program, please let me know.

    author.


    Hi,

    I am Tobias, I write this blog since 2014, you can find me on Twitter,
    LinkedInFacebook and YouTube. I work as a Senior Business Warehouse Consultant. In 2016, I wrote the first edition of Analysis Office – The Comprehensive Guide. If you want, you can leave me a PayPal coffee donation. You can also contact me directly if you want.


    Subscribe


    • In my newsletter, you get informed about new topics
    • You learn how to use Analysis Office
    • You get tips and tricks about SAP BI topics
    • You get the first 3 chapters of my e-book Analysis Office – The Comprehensive Guide for free
    /**/

    * indicates required

    You want to know SAP Analysis for Office in a perfect detail?
    You want to know how to build an Excel Dashboard with your Query in Analysis for Office? 
    You want to know how functions in SAP Analysis for Office works?


    Then you have to take a look into Analysis for Office  – The Comprehensive Guide. Either as a video course or as an e-book.


  • BW/4HANA Query Link Components

    In BW/4HANA SAP offers you the possibility to link restricted or calculated key figures across different Composite Providers. The advantage of the link components concept is that they can
    automatically synchronize whenever you make changes in the source or master component. If you are not familiar with this concept.


    SAP Help:

    A linked component can be automatically synchronized whenever changes are made to the corresponding source component.

    Example scenario: You have two highly similar InfoProviders, IP_A and IP_B. You have created the query Q_A for IP_A. You now want to create the query Q_B for
    InfoProvider IP_B. You want this query to be very similar to query Q_A and to be automatically adjusted whenever changes are made to query Q_A.

    To do this, you use the link component concept: You create the linked target query Q_B for source query Q_A. This is more than just a copy, as the system also
    retains the mapping information. This mapping information makes it possible to synchronize the queries.

    So the concept is really nice because you can ensure that your key figures with the same name has also the same configuration, e.g. your turnover is configured correctly on any Composite Provider
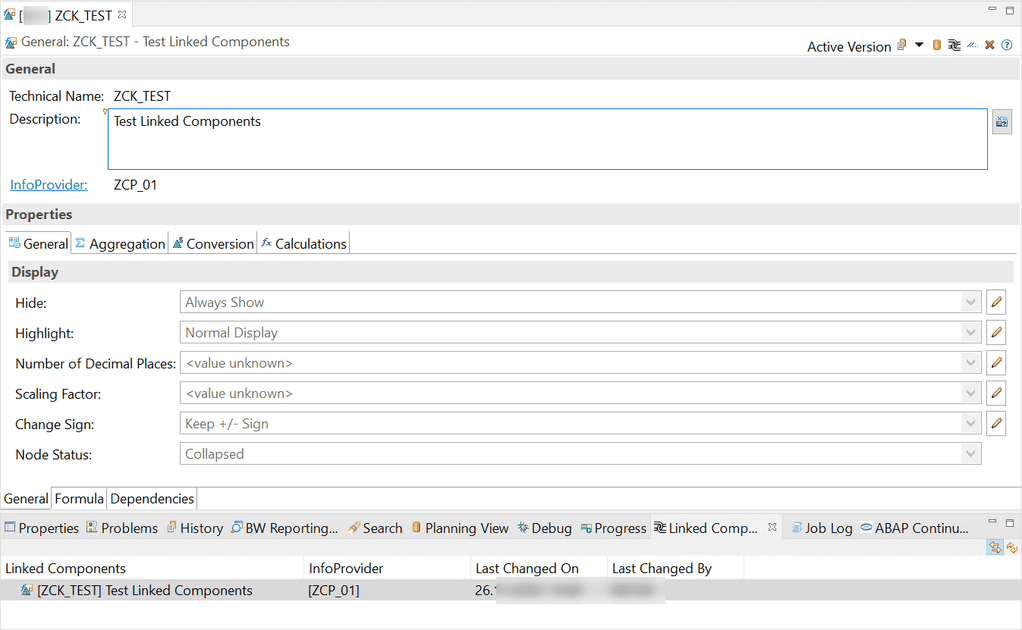
    in your system. Now let’s create a new link component. First we select a restricted key figure on our Composite Provider and goto „Linked Component“ view in Eclipse.

    New Keyfigure in Eclipse
    New Keyfigure in Eclipse

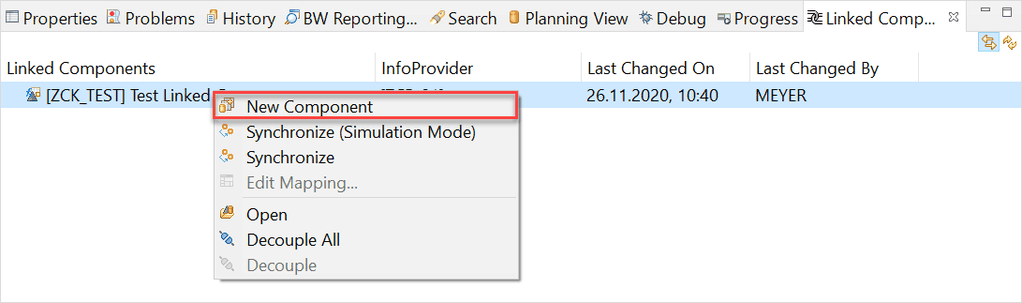
    Use the right click on the key figure in the „Linked Component“ view and select „New Component“

    New Query Link Component
    New Query Link Component

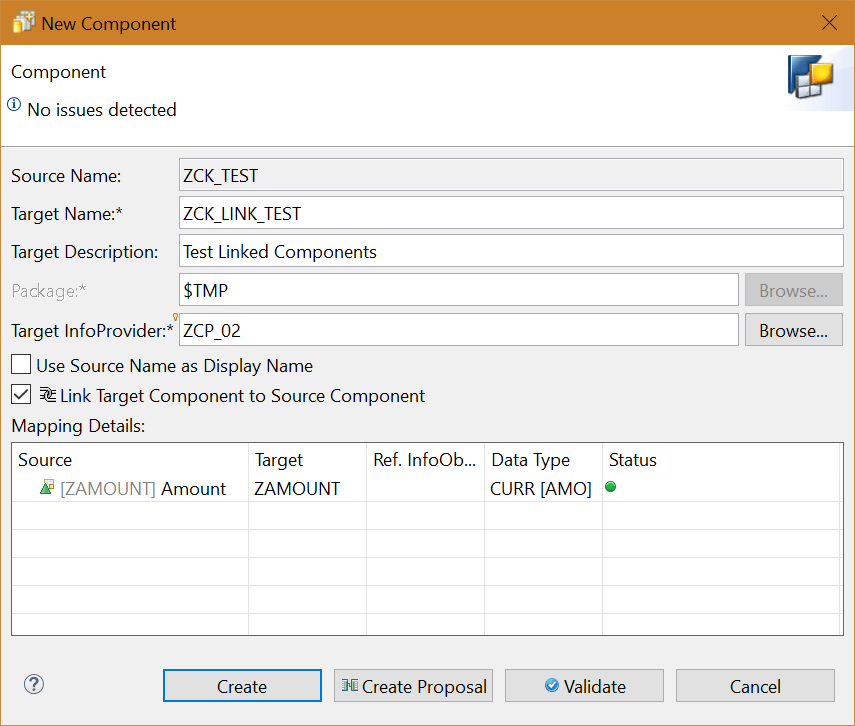
    A new dialog appears, which allows us to create a new linked key figure. First we have to define a Target Name and a Target InfoProvider. Now we can click on Create Proposal.

    Create new Query Link Component
    Create new Query Link Component

    After the status is green, we can create this new link component.

    Keyfigure with Link Component
    Keyfigure with Link Component

    So now let’s come to an issue what happen when you unlink your query components by mistake. Here the trouble begins. There is no function to link your broken query link component again to the
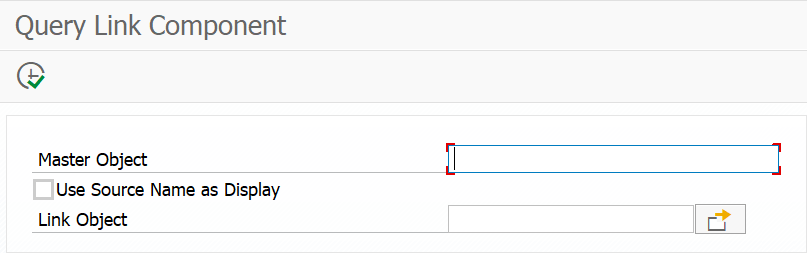
    original target. Which means you have to create a new link component and replace it in all your queries but for this I create a little tool called Query Link Component to link the components again.


    Query Link Component Tool
    Query Link Component Tool

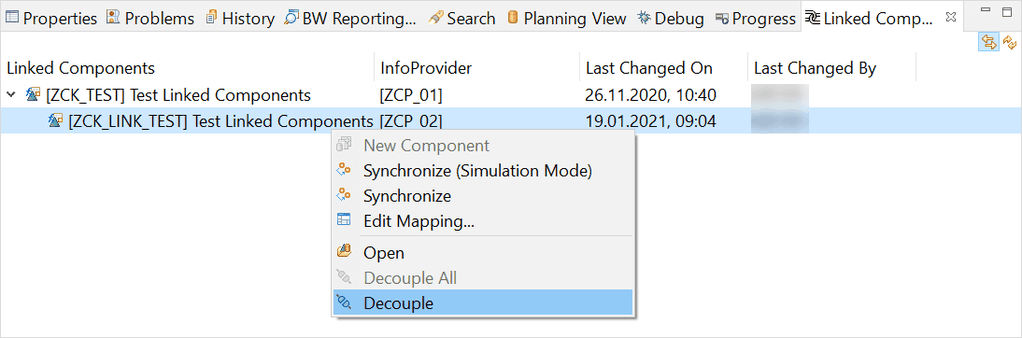
    So let’s make an example, we just decouple our created link component and link it afterwards again.

    Decouple an existing link component
    Decouple an existing link component
    Keyfigure without Link Component
    Keyfigure without Link Component

    Now we open the Query Link Component program and fill out all necessary information and link our key figure again.

    Create the Link Component again
    Create the Link Component again

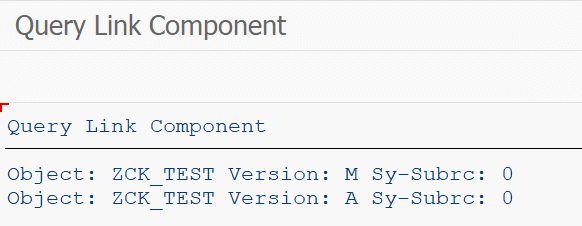
    Click on Execute (F8)

    Linking was successful
    Linking was successful

    Now we close and reopen the key figure in Eclipse, and we will see the link component is back again.

    Query Link Component works again
    Query Link Component works again

    Conclusion

    I like the concept of linked components in BW/4HANA, but I don’t know why SAP has no such function to link a broken query component again. My little tool helps me to fix this issue and save me a
    lot of time. Do you use the Link Components Concept in your BW/4HANA?

    author.


    Hi,

    I am Tobias, I write this blog since 2014, you can find me on Twitter,
    LinkedInFacebook and YouTube. I work as a Senior Business Warehouse Consultant. In 2016, I wrote the first edition of Analysis Office – The Comprehensive Guide. If you want, you can leave me a PayPal coffee donation. You can also contact me directly if you want.


    Subscribe


    • In my newsletter you get informed about new topics
    • You learn how to use Analysis Office
    • You get tips and tricks about SAP BI topics
    • You get the first 3 chapters of my e-book Analysis Office – The Comprehensive Guide for free
    /**/

    * indicates required

    You want to know SAP Analysis Office in a perfect detail?
    You want to know how to build an Excel Dashboard with your Query in Analysis Office? 
    You want to know how functions in SAP Analysis Office works?


    Then you have to take a look into Analysis Office  – The Comprehensive Guide. Either as a video course or as an e-book.

  • BW/4HANA XXL InfoObjects

    Last week a colleague and I look into the XXL InfoObjects in SAP BW/4HANA. We searched the online help and there is a short video about the topic. But after that we
    had no clue how we can use it. Can we use it in Analysis for Office? Or just in the query or Composite Provider? What is the purpose of these InfoObjects? Can we store a documentation and open it
    directly from the query?

    So I build an example XXL InfoObject and added it as a XXL Attribute to an InfoObject. This InfoObject was in my Composite Provider, so I looked into the Composite Provider with Analysis for
    Office and don’t see the XXL InfoObject. So we are back to start. What can I do with it? Now I asked around on twitter. And I was surprised about the answers.

    Jakob wrote:

    „Its not only to use it. You have to maintain, visualize and to report it. One of the miracles. Man people wants it , test it……a few scenarios which is
    valueble…..“


    Roland
    wrote:

    „Indeed, looked
    promising, never found a usecase“


    Georgios
    wrote:

    „I don’t see any use case to be honest. I wanted to use them once to report on some quite long text values until I realized they can’t be used in reporting.“


    Jakob wrote:

    We used it in planning application to comment keyfigures. Onother case was to integrate PDF in dashbords for documentations. Another usecase was to Integrated CAD
    drawings in a dashboard for Real Estate application. To store is not the problem anymore. To visualize edit etc..


    Jakob wrote:

    We used WAD and in the row there was displays a icon. After clicking you got a separete window. I have to look for the fuba or Some documentation. It was not
    completly visible! Thats what i mean vizualising and reporting can be a challenge 🙂


    Marc wrote:

    Haven’t tried but the announcement included an example https://blogs.sap.com/2019/09/23/improvements-of-bw4hana-analytical-engine-in-q3-2019-with-nw-bw-sp16-or-q1-2020-with-bw4hana-2.0-sp4/


    Conclusion

    So now I have a possible purpose but no clue how to use it exactly. Maybe someone from SAP can light me up? Or show some use cases? Thanks to all answers, maybe someone has another good idea? You
    can leave it in the comments.

    author.


    Hi,

    I am Tobias, I write this blog since 2014, you can find me on Twitter,
    LinkedInFacebook and YouTube. I work as a Senior Business Warehouse Consultant. In 2016, I wrote the first edition of Analysis Office – The Comprehensive Guide. If you want, you can leave me a PayPal coffee donation. You can also contact me directly if you want.


    Subscribe


    • In my newsletter you get informed about new topics
    • You learn how to use Analysis Office
    • You get tips and tricks about SAP BI topics
    • You get the first 3 chapters of my e-book Analysis Office – The Comprehensive Guide for free
    /**/

    * indicates required

    You want to know SAP Analysis Office in a perfect detail?
    You want to know how to build an Excel Dashboard with your Query in Analysis Office? 
    You want to know how functions in SAP Analysis Office works?


    Then you have to take a look into Analysis Office  – The Comprehensive Guide. Either as a video course or as an e-book.

  • BW/4HANA 2.0 Composite Provider with InfoObject Join

    At the end of last month I ask on Twitter why I should create a join between an Advanced DataStoreObject and an InfoObject to read the attributes from
    this InfoObject when I even can activate the attributes on the output tab of the Composite Provider in SAP BW/4HANA. The answers on Twitter was not satisfactory, and I ask a colleague if he
    knew a reason. So I build a Composite Provider with a join between an InfoObject and an ADSO in our BW/4HANA system.

    SAP BW/4HANA 2.0 Composite Provider Join
    SAP BW/4HANA 2.0 Composite Provider Join

    Now I have the same picture as in my post on Twitter. The screenshot there is from the book BW4/HANA – An Introduction. So maybe when this book came out in 2017 it was a good idea to build a
    Composite Provider like this. So let’s give it a try. First we need some data for our ADSO, so I used my Sales Data DSO which I already have. Then we have to create for this test an attribute. I
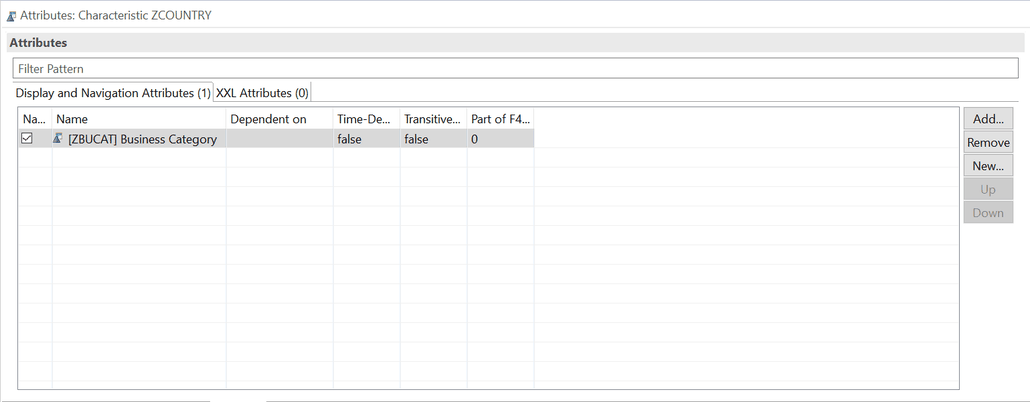
    decided to add the Business Category to my Country InfoObject.

    SAP BW/4HANA 2.0 InfoObject with Navigation Attribute
    SAP BW/4HANA 2.0 InfoObject with Navigation Attribute

    Now I thought I don’t win anything when I join the InfoObject Country with my ADSO Sales Data and add the Business Category from the InfoObject to my Composite Provider. So there must be a way to
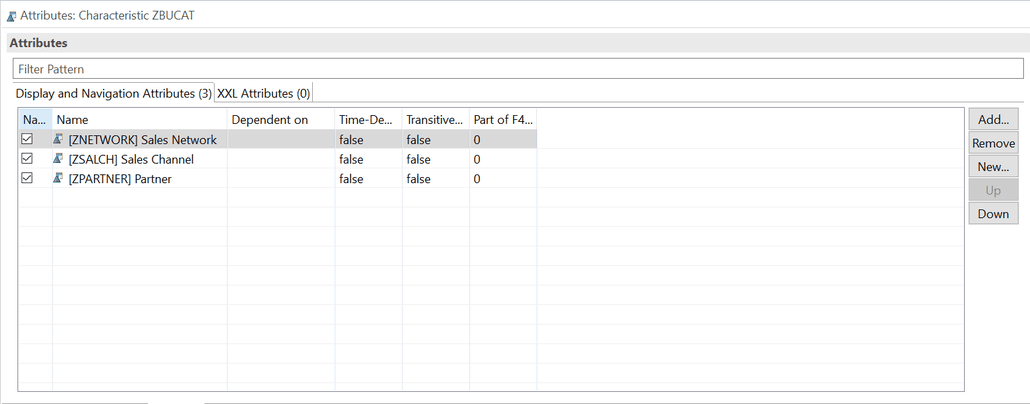
    use this scenario. So I added to my InfoObject Business Category the InfoObject Partner.

    SAP BW/4HANA 2.0 InfoObject with Navigation Attribute
    SAP BW/4HANA 2.0 InfoObject with Navigation Attribute

    Now we are facing some cool idea. Can I report on my Partner and get the Sales Data for it? Even when the Partner is not in the ADSO or has a relationship to an object which is directly in the
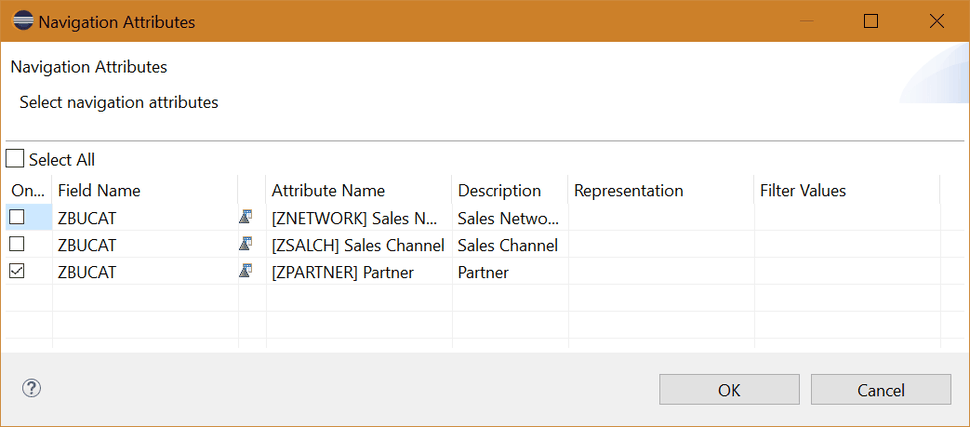
    Advanced DataStoreObject? So we can now activate on the output tab of the Composite Provider the navigation attribute of my Business Category.

    SAP BW/4HANA 2.0 Activate Navigation Attribute on Composite Provider
    SAP BW/4HANA 2.0 Activate Navigation Attribute on Composite Provider

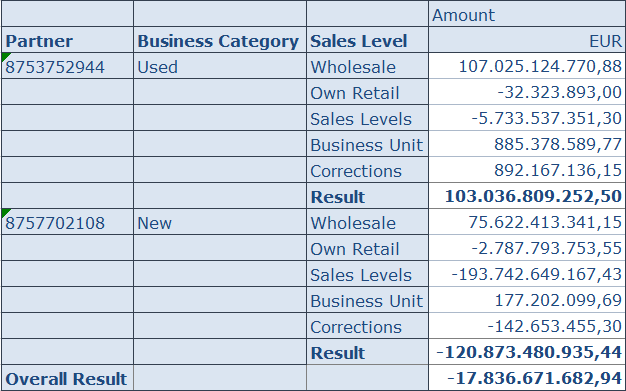
    So let’s look into SAP Analysis for Office and analyze the data with the Partner.

    SAP Analysis for Office report
    SAP Analysis for Office report

    And voilà it works perfectly. Now I can analyze my data with a dimension which has nothing to do with my data model. 

    Conclusion

    So I think this could be a nice way to combine data with InfoObjects which have nothing to do with the data model. So It could be for example to report the sales rep responsible profit
    center with some financial data which as only the customer in the data model. So you have a link between the customer and as navigation attribute the sales rep. And each sales rep has a profit
    center. What do you think about this idea?

    author.


    Hi,

    I am Tobias, I write this blog since 2014, you can find me on twitter,
    facebook and youtube. I work as a Senior Business
    Warehouse Consultant. In 2016, I wrote the first edition of Analysis Office – The
    Comprehensive Guide
    . If you want you can leave me a paypal coffee donation.
    You can also contact me directly if you want.


    Subscribe


    • In my newsletter you get informed about new topics
    • You learn how to use SAP Analysis for Office
    • You get tips and tricks about SAP BI topics
    • You get the first 3 chapters of my e-book SAP Analysis for Office – The Comprehensive Guide for free
    /**/

    * indicates required

    You want to know SAP Analysis for Office in a perfect detail?
    You want to know how to build an Excel Dashboard with your Query in Analysis for Office? 
    You want to know how functions in SAP Analysis for Office works?


    Then you have to take a look into Analysis for Office  – The Comprehensive Guide. Either as a video course or as an e-book.


  • BW/4HANA 2.0 Agile Open ODS View Modeling

    Open ODS are a long time available in SAP NetWeaver BW. You can access directly database tables, database views or BW/4HANA DataSources (for direct access). In this blog post I want to look into
    the fast and agile modeling with Open ODS Views. So we start with a flat file we for example received from our customer to build a new data flow for reporting. The file has the following
    structure:

    • Country
    • Product
    • Business Category
    • Controlling Area
    • Profit Center
    • Month
    • Year
    • Amount

    I created a test file with 10.000.000 entries to get some data we can play with. Now we create based on this file a data source to import the data.

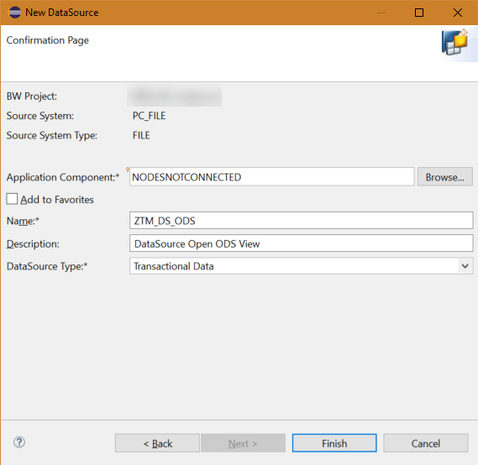
    Create Data Source
    Create Data Source

    Now after we created our data source, we have to switch on the option „Direct Access“ in the extraction tab.

    Activate Direct Access
    Activate Direct Access

    Now we have to read the file and determine the fields we need. After that we can go to model our Open ODS View and Composite Provider to report the data very fast.

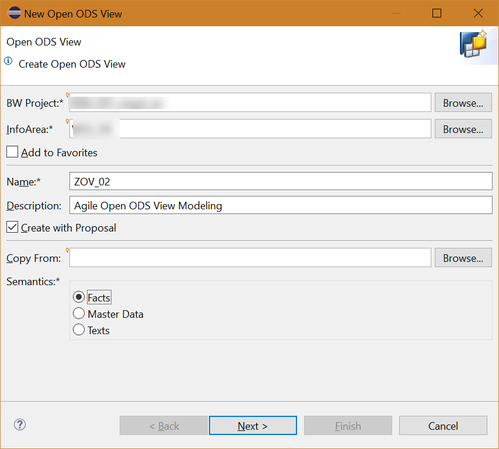
    Create Open ODS View
    Create Open ODS View
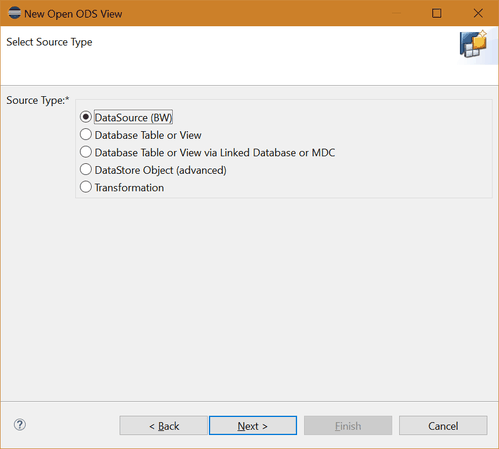
    Open ODS View Source Type: DataSource
    Open ODS View Source Type: DataSource


    So after we created now our Open ODS View based on our data source, we can build a CompositeProvider on top to make it available on reporting.

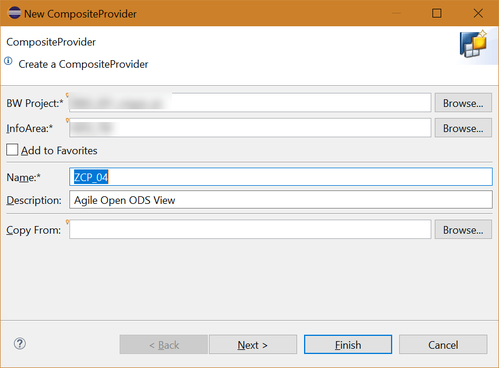
    Create CompositeProvider
    Create CompositeProvider
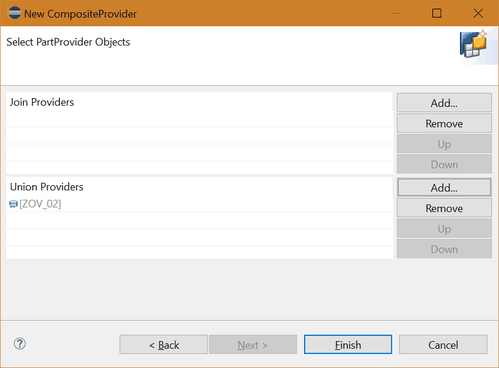
    Add Open ODS View to CompositeProvider
    Add Open ODS View to CompositeProvider


    So now we have our CompositeProvider to report on it. This steps only took a short time to model a simple data flow and provider some data to the business department.

    Adhoc view of the data
    Adhoc view of the data

    So now after the business looked into the data and agreed to persist the data in the Business Warehouse, we can now create directly out of the Open ODS View an DSO with a simple transformation.

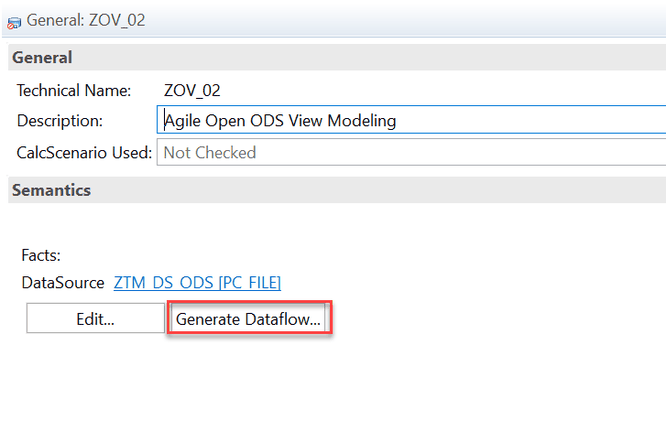
    Generate Data Flow
    Generate Data Flow

    By clicking on Generate Dataflow, a persistent data flow can be created.

    Generate ADSO
    Generate ADSO
    ADSO General Tab
    ADSO General Tab
    ADSO Detail Tab
    ADSO Detail Tab

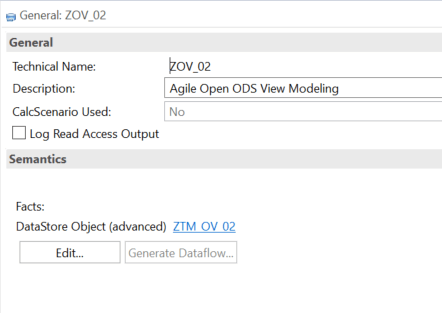
    Now the basic ADSO is created and can store our data. The Open ODS View also switched to the ADSO as source.

    Open ODS View with ADSO as source
    Open ODS View with ADSO as source

    Now we can remove the Open ODS View and include the ADSO into the CompositeProvider. This basic introduction shows you how easy it is to provide a data model to the business users.

    Conclusion

    I think that it is now easy possible to provide a table or CSV file to the data owner and show how to use it. If the adoption of the developer was right it is easy to implement a persistent data
    model with more logic. I think this agile concept is very nice, and I will look into it deeper under the point of view to implement more logic into the Open ODS View. I hope you like this example
    and share some of your experience in the comments.

    author.


    Hi,

    I am Tobias, I write this blog since 2014, you can find me on twitter,
    facebook and youtube. I work as a Senior Business
    Warehouse Consultant. In 2016, I wrote the first edition of Analysis Office – The
    Comprehensive Guide
    . If you want you can leave me a paypal coffee donation.
    You can also contact me directly if you want.


    Subscribe


    • In my newsletter you get informed about new topics
    • You learn how to use Analysis Office
    • You get tips and tricks about SAP BI topics
    • You get the first 3 chapters of my e-book Analysis Office – The Comprehensive Guide for free
    /**/

    * indicates required

    You want to know SAP Analysis Office in a perfect detail?
    You want to know how to build an Excel Dashboard with your Query in Analysis Office? 
    You want to know how functions in SAP Analysis Office works?


    Then you have to take a look into Analysis Office  – The Comprehensive Guide. Either as a video course or as an e-book.

  • BW/4HANA 2.0 Composite Provider Modeling

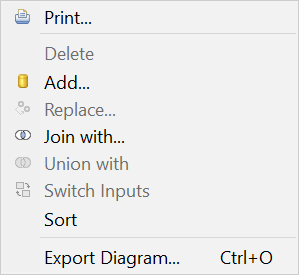
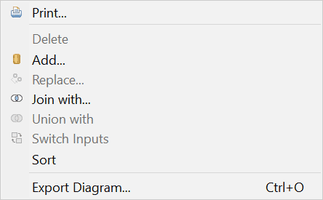
    I lately looked deeper into the modeling of Composite Provider in BW/4HANA 2.0 and found some difference between a BW/4HANA 1.0, BWonHANA 7.50 and the latest version BW/4HANA 2.0. So let’s
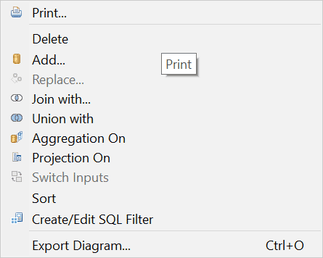
    compare them and see what’s new, and we can go deeper in further posts. We start with the context menu of the scenario for the provider.

    SAP BWonHANA 7.5
    SAP BWonHANA 7.5
    SAP BW/4HANA 1.0
    SAP BW/4HANA 1.0
    SAP BW/4HANA 2.0
    SAP BW/4HANA 2.0


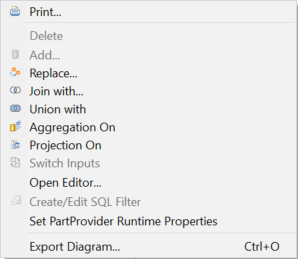
    As you can see the BW/4HANA 1.0 and BWonHANA 7.5 is quite the same but BW/4HANA 2.0 has some more entries in the context menu. We now see there an Aggregation, Projection and a Create/Edit SQL
    Filter. Also, the join types are enhanced with Full Outer-, Referential-, Right Outer Join instead of only Inner and Left Outer Join on BW/4HANA 1.0.


    You have now also some different join operations like:

    • Equal to
    • Greater Than or Equal to
    • Greater Than
    • Less Than or Equal to
    • Less Than
    • Not Equal to

    So you can build more flexible joins.


    So we have here some similar functions to a SAP HANA Calculation View? Or what can we do with it? I will build a Composite Provider with Aggregation or Projection and a SQL Filter in a demo. Now
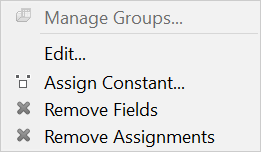
    lets dive into the context menu of the mapping.

    SAP BWonHANA 7.5
    SAP BWonHANA 7.5
    SAP BW/4HANA 1.0
    SAP BW/4HANA 1.0
    SAP BW/4HANA 2.0
    SAP BW/4HANA 2.0


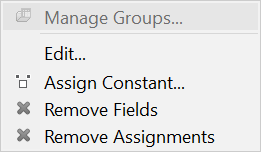
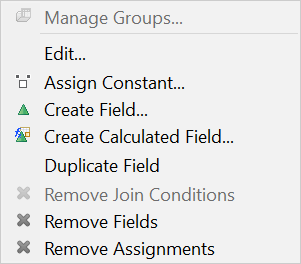
    As you can see the context menu here also expanded with some new features. Like Create Field, Create Calculated Field and Duplicate Field. So what are these new things?

    Aggregation & Projection

    To say it in SAP language the two new types of nodes (Aggregation and Projection) is to simplify modeling in SAP BW/4HANA. But what can we do with it? With the Aggregation Node
    we can aggregate key figure values in the target structure of the Composite Provider. This is similar to the functionality which is already provided in the SAP HANA Calculation View. But we have
    in the Composite Provider less aggregation types than in a SAP HANA Calculation View.


    The Projection Node is mainly there to define the output structure and add a filter on a specific part provider. 

    SQL Filter

    We start with the function SQL Filter and see how it works. If you want to add a SQL Filter, you need either an Aggregation or a Projection on top of your part provider. Now we are able to add a
    SQL Filter with the HANA SQL Script language. You find the HANA SQL Script reference here.

    Create/Edit SQL Filter inactive
    Create/Edit SQL Filter inactive

    As you can see on a part provider the function is disabled.

    Calculated Fields and Fields

    With Calculated Fields it is possible to enrich or refine data from part providers with additional business logic in SAP HANA SQL syntax. You can also add simple Fields as well. Both fields can
    be defined either as Characteristics or as a Key Figure. As a characteristic the option „Forced Group by“ can also be enabled.

    Example

    So let’s build some different cases and see what is happening. We have 3 ADSOs with the following structure:

    • ADSO 1: Sales DE
      • 0Country, 0CALMONTH2, 0CALYEAR, 0AMOUNT
    • ADSO 2: Sales US/DE
      • 0COUNTRY, 0CALDAY, 0AMOUNT
    • ADSO 3: Sales Profit Center
      • 0PROFIT_CTR, 0CO_AREA, 0CALYEAR, 0CALMONTH2, 0AMONT_LC

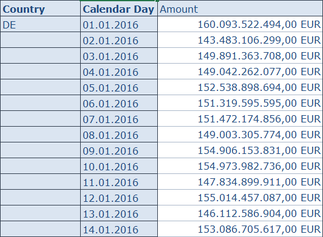
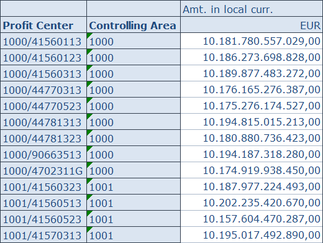
    As you can see every ADSO has a different structure and ADSO 2 has a detailed view of the data of ADSO 1. So let’s look into the data:

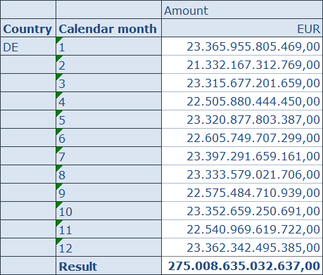
    ADSO 1: Sales DE
    ADSO 1: Sales DE
    ADSO 2: Sales US/DE
    ADSO 2: Sales US/DE
    ADSO 3: Sales Profit Center
    ADSO 3: Sales Profit Center


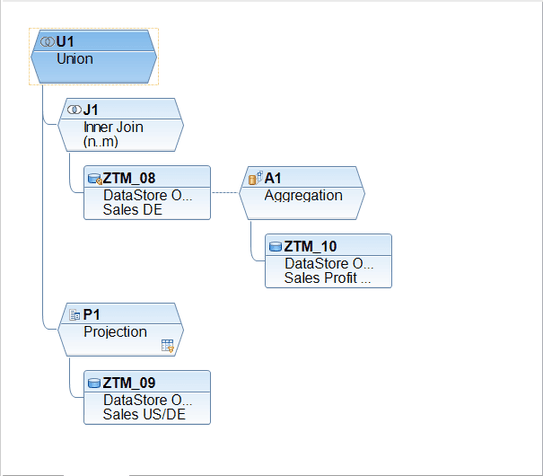
    Now we want to combine the data of ADSO 1: Sales DE with information of ADSO 2: Sales US/D as well as enhance ADSO 1 data with ADSO 3: Sales Profit Center values. So let’s get started: 

    Composite Provider Modeling
    Composite Provider Modeling

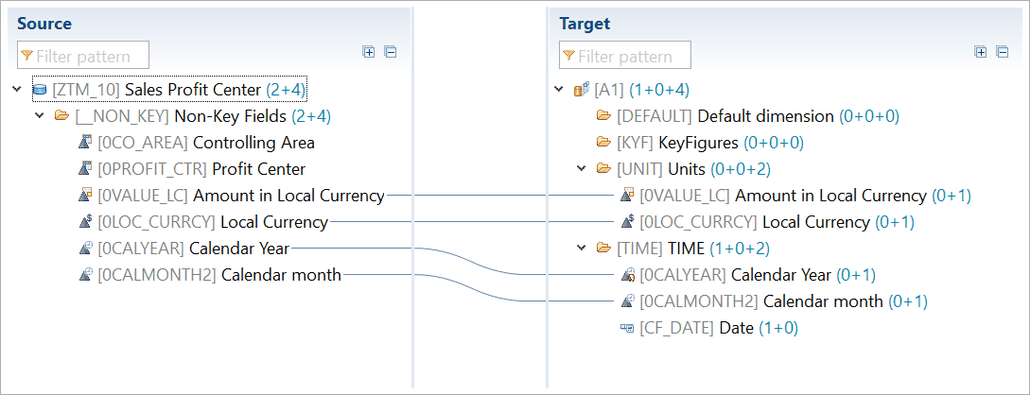
    Step 1: Since our Sales DE and the Sales Profit Center have different granularity, an additional aggregation is build on top of the ADSO 3. We want to remove the Controlling Area
    and Profit Center information and join it with ADSO 1: Sales DE.

    Mapping ADSO 3: Sales Profit Center to Aggregation
    Mapping ADSO 3: Sales Profit Center to Aggregation

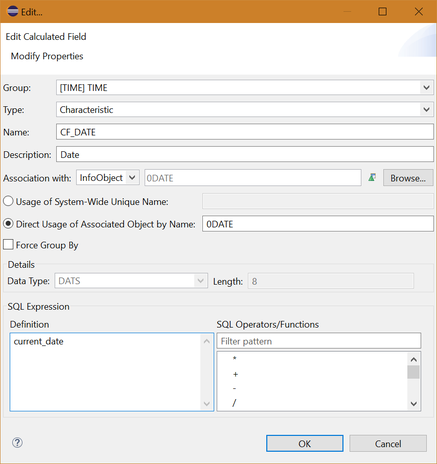
    Step 2: In this example we get the current date as a calculation field as a characteristic, and we enable „Forced Group By“ for 0CALYEAR.

    Calculated Field Date
    Calculated Field Date
    0CALYEAR Force Group By
    0CALYEAR Force Group By


    Step 3: ADSO 1 is joined with the aggregation of our ADSO 3. Here we define a calculation field and calculate the variance between the Amount and the Amount in Local Currency.
    The join condition is based on 0CALYEAR and 0CALMONTH2.

    Join between ADSO Sales DE and Sales Profit Center
    Join between ADSO Sales DE and Sales Profit Center
    Join between ADSO Sales DE and Sales Profit Center
    Join between ADSO Sales DE and Sales Profit Center
    Calculated Field Variance
    Calculated Field Variance


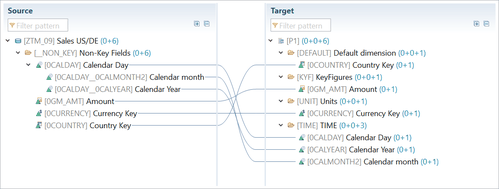
    Step 4: Our Sales US/DE includes the Sales from US and from DE. To avoid duplicate data with ADSO 1: Sales DE, we create a projection on top of the ADSO 2 and use SQL Filter to
    select only the US data. We also activate the navigation attributes 0CALMONTH2 and 0CALYEAR from 0DATE.

    Mapping of navigation attributes
    Mapping of navigation attributes
    SQL Filter
    SQL Filter


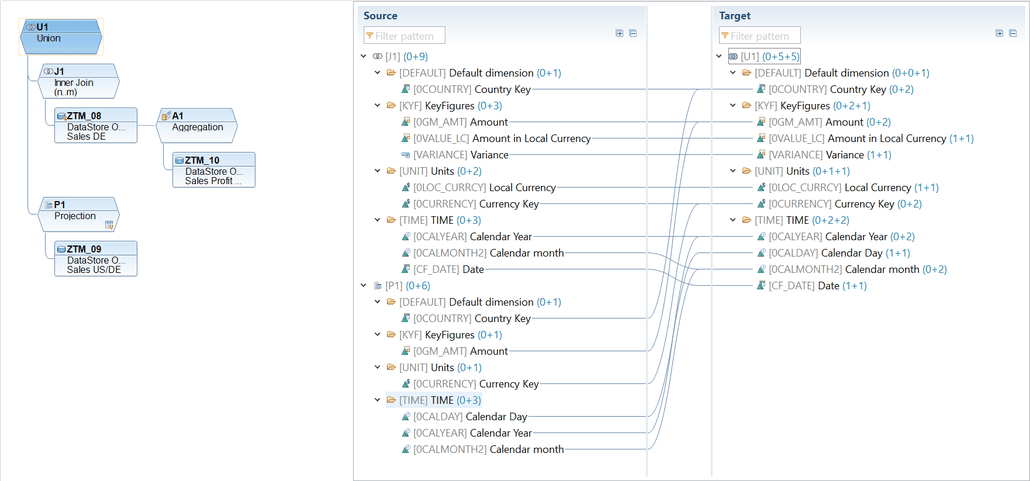
    Step 5: In the UNION, we map the date field from ADSO 2: Sales US/DE to the current date from the Join. The fields 0CALMONTH2 and 0CALYEAR are mapped with from the
    navigational attributes of 0CALDAY.

    Step 6: The result is now showing in Analysis for Office. As you can see, the Sales DE ADSO is enriched to the Sales of the Profit Center ADSO. We also see the variance and the current date. The
    Sales from US only get the column Amount filled.

    Result of Composite Provider
    Result of Composite Provider

    Conclusion

    It is really cool, that we are able to build more flexible Composite Provider, but I miss a data preview function for each node. This could be a nice feature in the future. Do you like this
    feature? Any ideas what you can do with it?

    author.


    Hi,

    I am Tobias, I write this blog since 2014, you can find me on twitter,
    facebook and youtube. I work as a Senior Business
    Warehouse Consultant. In 2016, I wrote the first edition of Analysis Office – The
    Comprehensive Guide
    . If you want you can leave me a paypal coffee donation.
    You can also contact me directly if you want.


    Subscribe


    • In my newsletter you get informed about new topics
    • You learn how to use Analysis Office
    • You get tips and tricks about SAP BI topics
    • You get the first 3 chapters of my e-book Analysis Office – The Comprehensive Guide for free
    /**/

    * indicates required

    You want to know SAP Analysis Office in a perfect detail?
    You want to know how to build an Excel Dashboard with your Query in Analysis Office? 
    You want to know how functions in SAP Analysis Office works?


    Then you have to take a look into Analysis Office  – The Comprehensive Guide. Either as a video course or as an e-book.


  • BW/4HANA: Customer Exit Variable with dynamic assignment

    You have different ways to store the logic of your customer exit variables in SAP BW/4HANA. After my last post about Customer Exit Variables with an own enhancement spot I want to share another solution
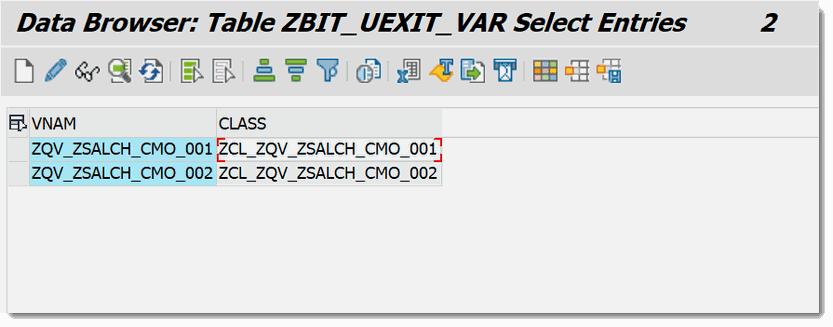
    with you. In this blog post I want to show you how you can implement a BAdI implementation with a Z-Table (Customer Table). In this table you find the assignment between the BEx variable and the corresponding class for the customer exit. This is how the table will look like:

    SAP BW/4HANA Customer Table with assignment between variable and class
    Customer Table with assignment between variable and class

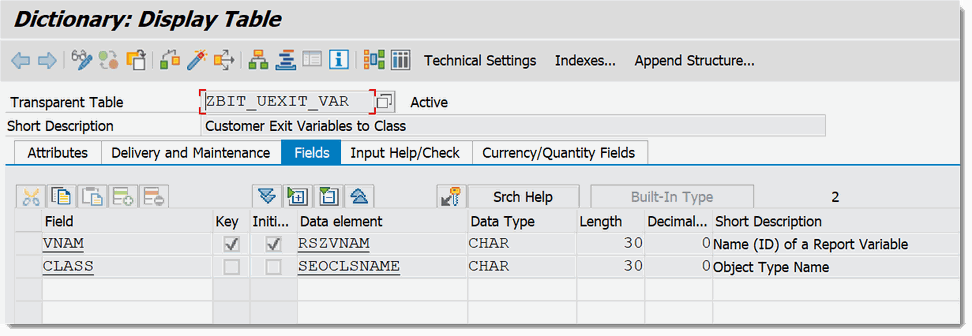
    We use this table to determine the corresponding class for our variable. The table structure is very simple. Just create this table in the transaction SE11. As you see the
    table has only two fields.

    SAP BW/4HANA Customer Table Structure
    Customer Table Structure

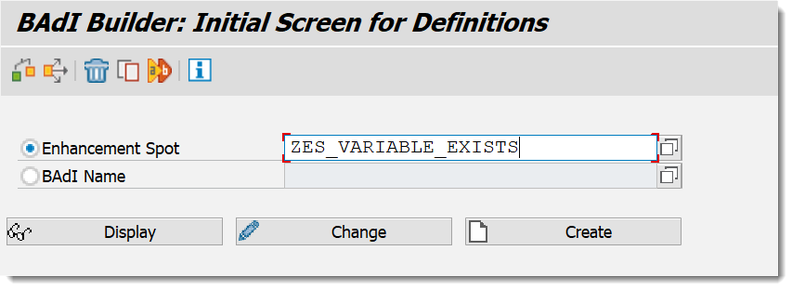
    After we have created the customer table in the transaction SE11 we go to the TA SE18 and open our own enhancement spot we created in „BW/4HANA 2.0 Customer Exit Variables with own enhancement spot„.

    SAP BW/4HANA Enhancement Spot
    Enhancement Spot

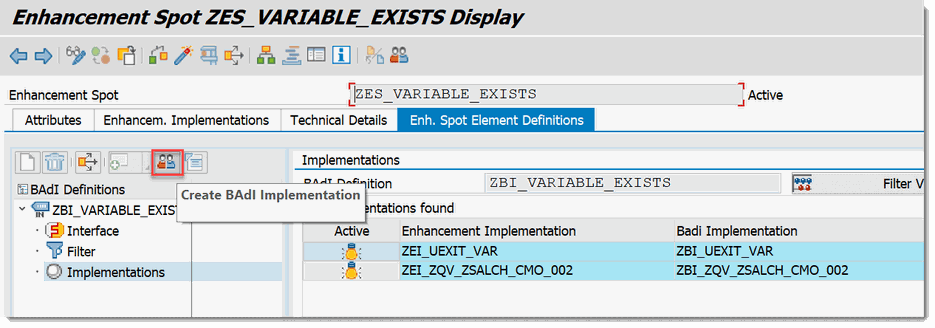
    There we create a new BAdI Implementation we will use for our dynamic assignment.

    SAP BW/4HANA Create BAdI Implementation
    Create BAdI Implementation

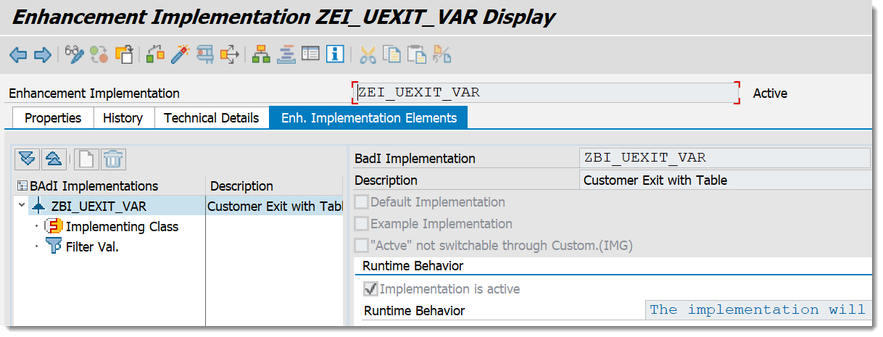
    In my case I give the name ZEI_UEXIT_VAR as Enhancement Implementation, ZBI_UEXIT_VAR as BAdI Implementation and ZCL_UEXIT_VAR as class.

    SAP BW/4HANA Enhancement Implementation ZEI_UEXIT_VAR with BAdI Implementation
    Enhancement Implementation ZEI_UEXIT_VAR with BAdI Implementation

    After we created the Enhancement Implementation, BAdI and class we now go to the transaction SE80 or to the Eclipse ADT and open our class. And add an attribute to the class.

    SAP BW/4HANA Add an attribute to our class
    Add an attribute to our class

    We add the attribute GV_VARIABLES_EXIT with the default value IF_RSROA_VARIABLES_EXIT_BADI to our class. After we have done this, we now implement the following code:

     1
     2
     3
     4
     5
     6
     7
     8
     9
    10
    11
    12
    13
    14
    15
    16
    17
    18
    19
    20
    21
    22
    23
    24
    25
    26
    27
    28
    29
    30
    31
    32
    33
    34
    35
    36
    37
    38
    39
    40
    41
    42
    43
    44
    45
    46
    47
      DATA: lr_class_info TYPE REF TO cl_oo_class,
            lr_exit_class TYPE REF TO object,
            ls_var_range LIKE LINE OF i_t_var_range,
            lt_interfaces TYPE seo_relkeys.
    
    
      IF i_step = 1 OR i_step = 2.
    
        SELECT SINGLE * FROM zbit_uexit_var INTO @DATA(ls_uexit_var) WHERE vnam = @i_vnam.
    
        IF sy-subrc = 0.
          TRY.
            CREATE OBJECT lr_class_info
              EXPORTING
                clsname = ls_uexit_var-class.
    
            lt_interfaces = lr_class_info->get_implemented_interfaces( ).
            IF NOT line_exists( lt_interfaces[ refclsname = gv_variables_exit ] ).
              RETURN. "Interface not exists.
            ENDIF.
    
          CATCH cx_root.
          ENDTRY.
    
          TRY.
            CREATE OBJECT lr_exit_class TYPE (ls_uexit_var-class).
    
            CALL METHOD lr_exit_class->('IF_RSROA_VARIABLES_EXIT_BADI~PROCESS')
              EXPORTING
                i_vnam        = i_vnam
                i_vartyp      = i_vartyp
                i_iobjnm      = ls_var_range-iobjnm
                i_s_cob_pro   = i_s_cob_pro
                i_s_rkb1d     = i_s_rkb1d
                i_periv       = i_periv
                i_t_var_range = i_t_var_range
                i_step        = i_step
              CHANGING
                c_t_range = c_t_range
                c_no_screen = c_no_screen
                c_check_again = c_check_again
                c_s_customer = c_s_customer.
          CATCH cx_rs_error INTO DATA(oref).
            RAISE EXCEPTION TYPE cx_rs_error.
          ENDTRY.
        ENDIF.
      ENDIF.
    

    After we have added the following code to our class and activate all stuff, we now can implement our logic for the two Customer Exit Variables I mentioned in the table above.


    I hope this gives you an idea how you can implement Customer Exit Variables. If there are any questions feel free to ask.

    author.


    Hi,

    I am Tobias, I write this blog since 2014, you can find me on twitter,
    facebook and youtube. I work as a Senior Business
    Warehouse Consultant. In 2016, I wrote the first edition of Analysis Office – The
    Comprehensive Guide
    . If you want you can leave me a paypal coffee donation.
    You can also contact me directly if you want.


    Subscribe


    • In my newsletter you get informed about new topics
    • You learn how to use Analysis Office
    • You get tips and tricks about SAP BI topics
    • You get the first 3 chapters of my e-book Analysis Office – The Comprehensive Guide for free
    /**/

    * indicates required

    You want to know SAP Analysis Office in a perfect detail?
    You want to know how to build an Excel Dashboard with your Query in Analysis Office? 
    You want to know how functions in SAP Analysis Office works?


    Then you have to take a look into Analysis Office  – The Comprehensive Guide. Either as a video course or as an e-book.