It is done. My Analysis for Office book is finished. You can now download the table of content and the release of the book is
next week. Have fun and if you have feedback send it to me.
I am Tobias, I write this blog since 2014, you can find me on twitter and youtube. If you want you can leave me a paypal coffee donation. You can also contact me directly if you want.
At the moment I am working very hard to get my book done, so this is only a short blog post how to use SAPGetVariable with VBA. The Analysis Office help provides no example so here it is:
1
2
Dim ret AsVariant
ret = Application.Run("SAPGetVariable", "DS_1", "0S_CUS", "INPUT_STRING_AS_ARRAY")
So the command need the data source and the variable, in my example DS_1 and 0S_CUS. It is very simple, but at the moment there is no example in the Analysis Office user guide.
I am Tobias, I write this blog since 2014, you can find me on twitter and youtube. If you want you can leave me a paypal coffee donation. You can also contact me directly if you want.
In Analysis for Office 2.2 SP3 some new interesting parameter for Ao_app.config were delivered. The following parameter are
interesting and in some case maybe very useful.
MaxNumberOfParallelThreads
Use this setting to define the maximum number of parallel threads that can be used to open the SAP HANA DataSources of a workbook. This only works with SAP HANA.
Use this setting to specify whether the logon dialog box should be displayed when using SSO with the BI platform. This maybe is interesting, if you want to change the logon language.
CancelPopupDelay
Since Analysis for Office 2.3 it is possible to cancel a query execution. This parameter defines how long the cancel dialog should be displayed. I think this is a really nice option of
Analysis for Office.
There are a lot of more settings for Ao_app.config in the Admin Guide of Analysis Office. Like for
example:
I am Tobias, I write this blog since 2014, you can find me on twitter and youtube. If you want you can leave me a paypal coffee donation. You can also contact me directly if you want.
Analysis for Office provides own Microsoft Excel formulas to show information
of your data source. I want to explain some functions and how to use them in a dashboard or a report.
The formula =SAPGetInfoLabel returns language-dependent label for an info field. This is really nice, if you have colleagues or customers who are not familiar with one language. For
example:
The information is either workbook or data source related. Which are exactly workbook or data source related can be checked in the user guide of Analysis for Office. For a dashboard these are relevant:
LastRefreshedAt
WorkbookName
LastDataUpdate
LastDataUpdateMaximum
QueryTechName
QueryLastRefreshedAt
InfoProviderTechName
System
To get values for the above-mentioned info fields, you have to use SAPGetWorkbookInfo and SAPGetSourceInfo.
If you want to display the filters of your dashboard, you have different formulas. For example:
=SAPListOfEffectiveFilters returns a list of all filters of a data source including dynamic filters defined by a user, static filters in the query and measure filter. If you want either
dynamic filters or measure filters you also can use =SAPGetListOfDynamicFilters or =SAPGetListOfMeasureFilters.
It depends on what you want to show in a report. If you want to make your dashboard interactive you can use =SAPSetFilterComponent, so the user can decide what to filter on a
specific data source
For example, this formula shows a filter for 0SOLD_TO and applies to all data sources in this workbook.
You also get a little filter icon to select via a dialog box your values.
So after the technical stuff is done, we can create our dashboard. I want to build a simple dashboard with a chart and a table, where the user can decide which data he wants to see.
Analysis for Office Dashboard Example
For the customer number in cell A1 we use this formula =SAPGetVariable(„DS_1″;“0S_CUS“;“VALUEASKEY“) because the user has to select a customer in the prompt dialog. For the name and
address I used the following commands:
Postal Code and City: =SAPGetMember(„DS_1″;“0SOLD_TO=“&A1;“0POSTAL_CD“) & “ “ & SAPGetMember(„DS_1″;“0SOLD_TO=“&A1;“0CITY“)
For the date I use the last refreshed of the query: =SAPGetWorkbookInfo(„LastRefreshedAt“). To display the last data update I use the formula =SAPGetSourceInfo(„DS_1“;
„LastDataUpdate“). For the InfoProvider I use =SAPGetSourceInfo(„DS_1“; „InfoProviderTechName“).
For the data of the table I use formulas like =SAPGetData(„DS_1″;“Net price“;“0MATL_GROUP=060″)
As you can see, it is very easy to build a beautiful report without any VBA coding. I hope this post help you to build your own dashboard. If you
like, you can share some of your ideas either via the comments or just send me a mail.
Update 21.05.2021:
As Jim mentioned in the comments I had a mistake that in some formulas the &-symbol was missing to concatenate the string correctly
I am Tobias, I write this blog since 2014, you can find me on twitter, facebook and youtube. I work as a Senior Business
Warehouse Consultant. In 2016 I wrote the first edition of . If you want you can leave me a paypal coffee
donation. You can also contact me directly if you want.
A feature of Bex Analyzer was the upload of selections, so you haven’t to type the selections all the time. This feature wasn’t available for Analysis for Office until version 2.2 SP3. So I looked deeper in this function and want to share my knowledge.
BEx Analyzer Upload Selection
Since I think Analysis for Office 2.1 it is also possible to filter your data by paste your selection from
a clipboard. In the settings of Analysis for Office you can define the number of members which are displayed in the filter dialog. If a dimension has more members than you defined in the user
settings, a filter dialog for mass data is opened. In this particular dialog you only see the selected members, but you can add members by using the input help.
Hint: You can also define the number of members by using the admin parameter FetchMemberLimit and you can also disabled the mass data dialog by using the
parameter EnableMassDataSelector.
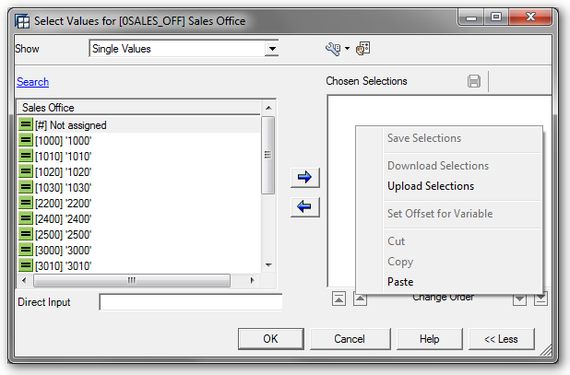
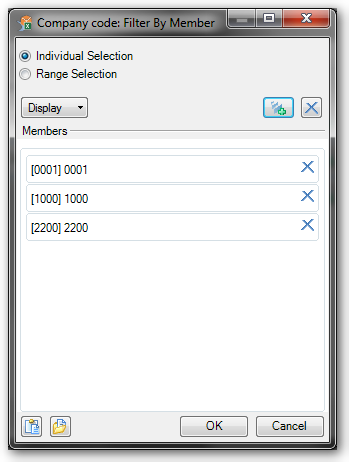
In the prompt dialog you have to select the „Add Lines Using Filter By Member“-Button.
Analysis for Office Prompt Filter by Member
Note: You only see this button, if your variable is either a selection option variable or allows several single values.
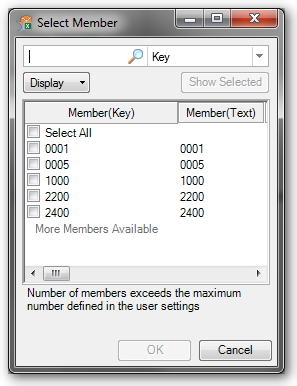
After you click on this button, a new dialog will popup, where you can filter by members of this dimension. If the number of members are more than the defined number in the user settings, you see
the filter dialog for mass data.
Analysis for Office Select Member
You are now able to paste your selection to the filter dialog by using the Paste from Clipboard icon at the left bottom of the filter dialog.
Note: The Members have to be displayed as key in the list.
If you want to insert a lot of members that you want to use for filtering, you can use Paste from File. The Paste from File icon is next to the Paste from Clipboard icon if you use an Analysis for Office version which is higher than 2.2 SP3.
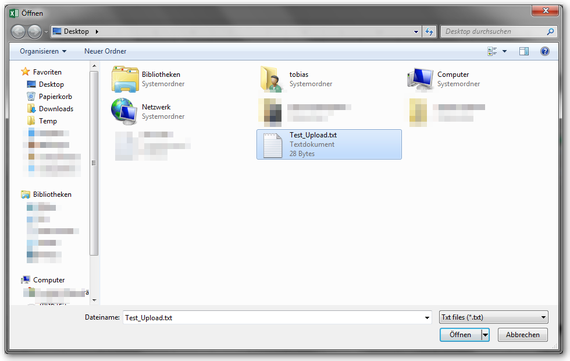
If you click on the button a windows open dialog appears and you can select the file which you want to upload.
Analysis for Office Select Textfile for Upload
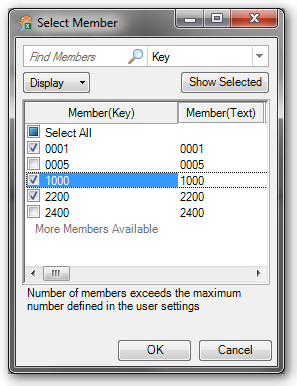
After you click „OK“ the members are added to the filter.
Analysis for Office Uploaded Members by Textfile
By click OK, the filter is applied.
Analysis for Office Selected Filter Values
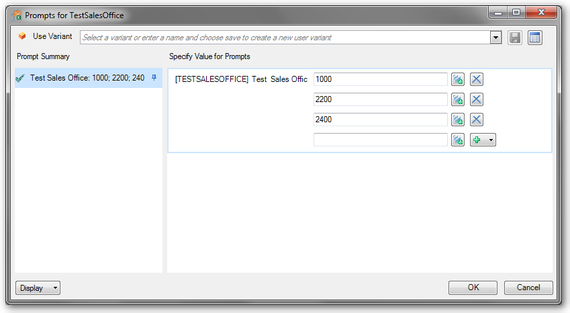
By click OK, the filter is applied to the prompt dialog.
Analysis for Office Prompt with Values
Now you can run your query and wait until you see your result. Another possibility is to filter your data by VBA code.
I am Tobias, I write this blog since 2014, you can find me on twitter and youtube. If you want you can leave me a paypal coffee donation. You can also contact me directly if you want.
Analysis for Office has different two kinds of variants. One is a workbook variant and the other is a DataSource variant. So what
is exactly the difference?
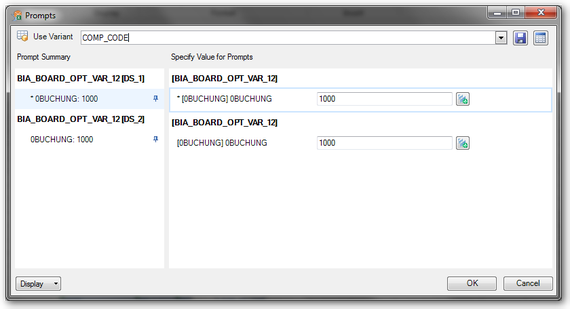
If you have a workbook you can save your variants in the prompt dialog.
Analysis for Office Save Variant
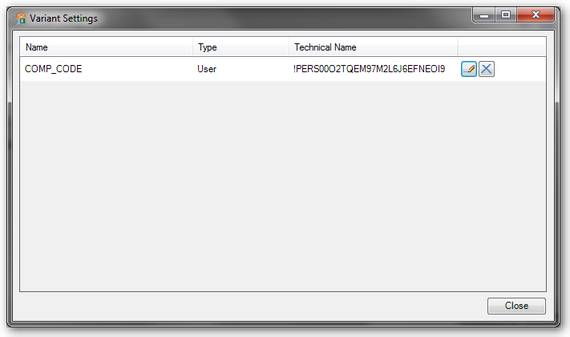
Enter your required values, a description for the variant and click the save button. This is now a user variant and only for your user available. When you want to use your variant as a global
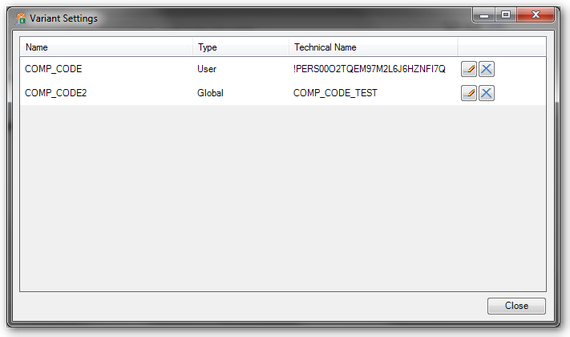
variant, you have to change the variant settings. In the variant settings you can also edit and delete a variant.
Analysis for Office Variant Settings
If you now change your user variant to a global variant, you have to choose a technical name and confirm the change.
Analysis for Office Global Variant
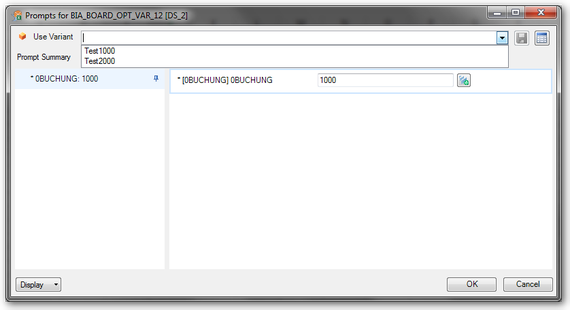
In the prompt dialog you see at first the user variants and underneath the global variants.
Analysis for Office Global vs. User Variant
If you have only one DataSource in a workbook you can also access the DataSource variant. To access the DataSource variants, you have to change the Ao_app.config and add the parameter
<ShowDSVariantsForWorkbookWithOneDS>
If you set this parameter to true you can save variants or select a saved variant for this DataSource.
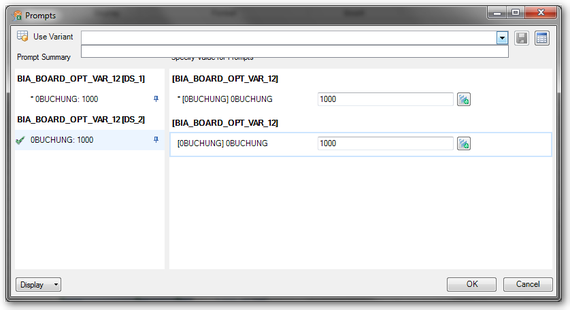
Analysis for Office Select DataSource Variants
When you insert the DataSource into a new workbook you can select the variant, but if you add more than one DataSource to the workbook the DataSource variant is not any longer available.
Analysis for Office Variant no longer available
The parameter ShowDSVariantsForWorkbookWithOneDS is nice if you use only one DataSource in a workbook and you want to use predefined variants.
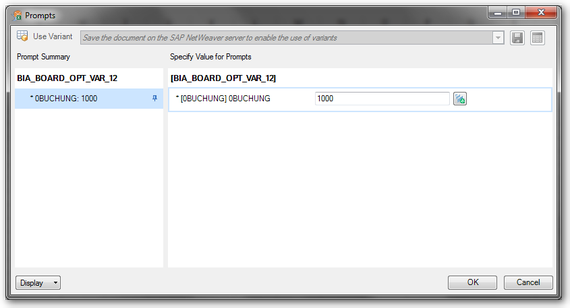
Note: Workbook variants are only available, if you save the workbook on a NetWeaver. If you have only a local workbook, you can’t use variants.
I am Tobias, I write this blog since 2014, you can find me on twitter and youtube. If you want you can leave me a paypal coffee donation. You can also contact me directly if you want.
Since Analysis for Office 2.0 the administrative settings are moved from the registry to the file system. These settings are now maintained in a XML file. As in my article “Analysis for Office 2.2 SP2”
mentioned the Ao_app.config is repeatedly expanded and sometimes there are new commands available.
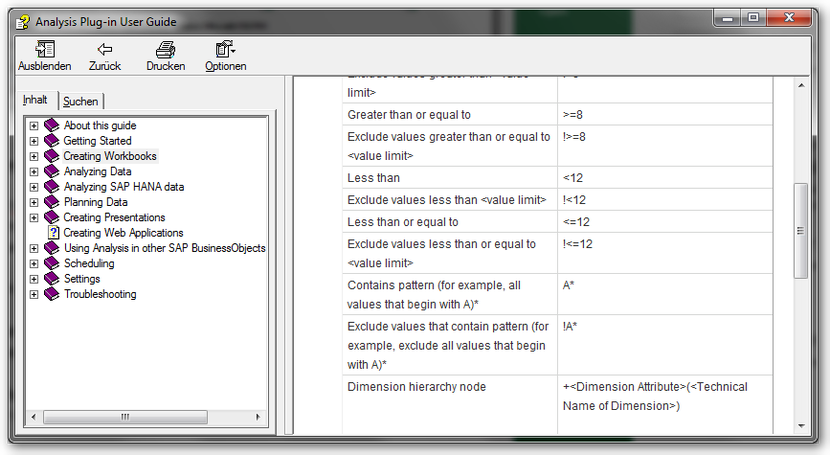
In this context the admin guide is always very useful. On this Topic there is also a SAP Note 1920589. To use “Contains Pattern” as it is described in the
Analysis for Office Help under “Syntax for Entering Values”, it must be activated in the Ao_user_roaming.config file.
Analysis for Office User Guide
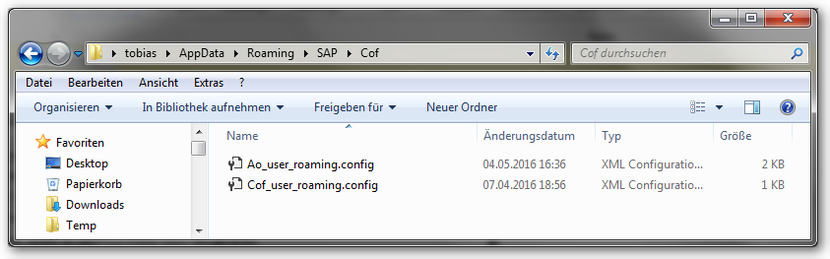
The file is located in the user folder AppDataRoamingSAPCof (%AppData%SAPCof).
AppdataRoamingSAPCof
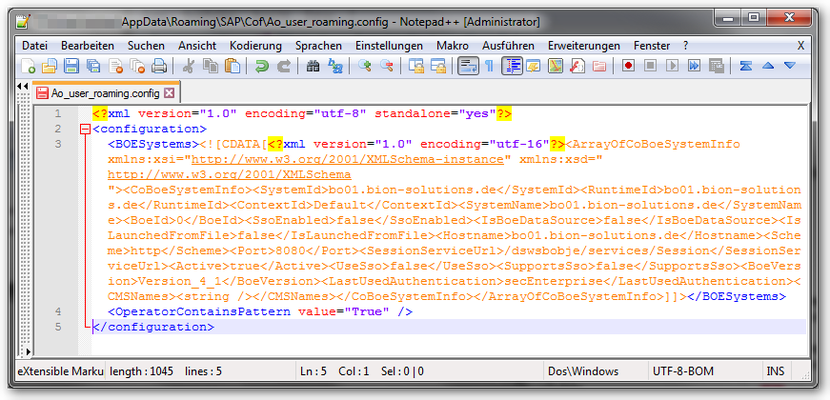
In this file you have to add the parameter <OperatorContainsPattern value=“True“ />.
Ao_user_roaming.config OperatorContainsPattern
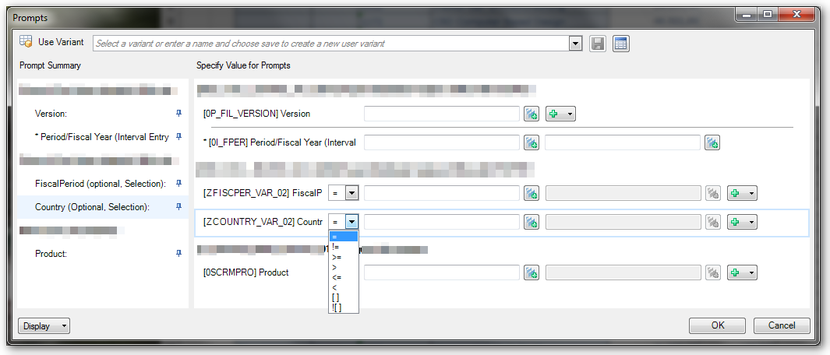
If you now use a variable, which supports pattern, your variables prompt should look like this.
Analysis Office Prompt with Pattern
Note: Until Analysis for Office 2.3 ContainsPattern only works if your variable is in Characteristic Restrictions. If your variable is in Default Values, you don’t see the ContainsPattern
option.
I am Tobias, I write this blog since 2014, you can find me on twitter and youtube. If you want you can leave me a paypal coffee donation. You can also contact me directly if you want.
I just got access to a NetWeaver 7.5 SP2 and I want to test it with Analysis for Office 2.3. So I open Excel and insert a query. And here we go first error: „unable to open data
source“, so I thought maybe the query is broken and I developed a new query and insert it. Here we go, same error. Maybe queries don’t work, so I insert a InfoCube directly. Same error…
Now I refresh the insert query and got an Analysis for Office message: Error while executing function module: BICS_PROV_OPEN
In the explanation was one line with the hint „wrong parameter type in an rfc call“, so I looked into st22 and saw a dump which the message: CALL_FUNCTION_ILLEGAL_P_TYPE
The explanation of this dump is „This error appears if parameters submitted incorrectly in a Remote Function Call.“
I searched but found nothing which should help me. After a longer research I found in the SCN this thread and the simple solution is:
Delete all contents in C:Users<your_user>AppDataRoamingSAP AGSAP BusinessObjects Advanced Analysiscache
After deleting the content, close Analysis for Office and it works. Either the Analysis for Office message or the BW dump explain the solution. But maybe someone has the same issue, this is the solution.
I am Tobias, I write this blog since 2014, you can find me on twitter and youtube. If you want you can leave me a paypal coffee donation. You can also contact me directly if you want.
So you were able to use own Excel formulas in a Crosstab. But in Analysis for Office 2.0 the formulas disappeared when you refreshed a query. Since Analysis for Office 2.2 the Excel formulas
survive a refresh. This is a really nice function. You can read this in the post „Analysis for
Office: How to work with Excel formulas„.
Now in Analysis for Office 2.2 SP3 the Table Design API got new rather advanced features like SAPSetText or SAPInsertLine. SAPInsertLine has now two new options for the parameter PositionBy:
DimensionGroup
Tuple
With SAPInsertLine you can add a new row or column via VBA. For Example:
With this command you add a new columns after the dimension 0CALYEAR. Be careful the Help file declares lResult as Long but this is wrong! To explain all SAPInsertLine parameter
I will write an own post.
You can use SAPSetText to add texts to inserted cells. You can also rename measures in the crosstab. At the moment I haven’t got any more information about this function. In Analysis for Office 2.3 you get a new feature, called Design Rules tab. You find the Design Rules on the 4th tab of the
Design Panel.
SAP Analysis for Office Design Panel
On the Design Rules tab you can see and edit the rules created with Table Design. The rules are displayed per DataSource and rule type. First you select the DataSource and then the rule type. You
can actually choose between four rule types:
Format
Formula
Text
New Lines
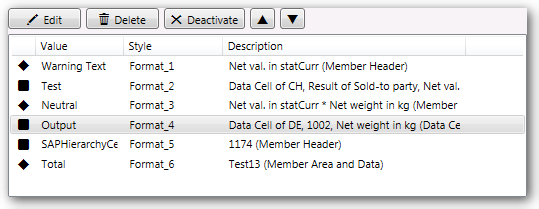
The accessible rule types are displayed in a Dropdown Box for the selected DataSource. The first column show you if the rule is active or deactivated. If you see a square the rule is active, if
you see a diamond the rule is deactivated. If you deactivate a NewLine-Ruletype the line disappear from the table design.
Active Rule
Deactivate Rule
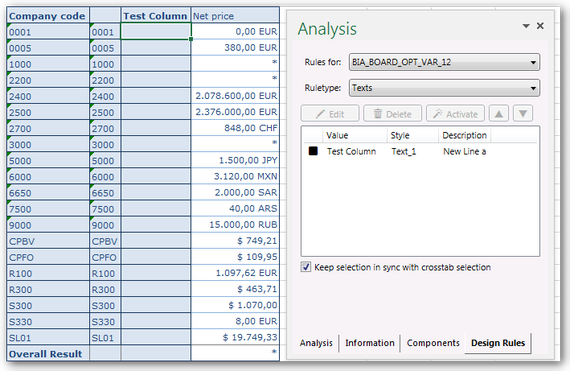
The value column show for example the content of a text rule.
SAP Analysis for Office Design Rules Ruletype Text
The style is an ID that is unique for each rule. The description is automatically set by the Analysis for Office for formats, formulas and texts. NewLines haven’t got a description.
The priority of a rule can be changed by the arrows above the list. You can easily move the rules up and down.
SAP Analysis for Office Design Rules Move Rule
You can edit only formats and new line-rules directly from the Design Rules tab. The other rules can only be deleted, activate or deactivate in the Design Rules tab.
Note: You can only edit new line rules after you change the height of a new line once manually.
If you have a large report with many design rules you love the feature „Keep selection in synch with crosstab selection“ because if you select a cell in the crosstab, the associated rule is
highlighted in the text.
Note: It is highlighted only if you are in the right list. For example if you click on a formula, but your list is on new line, nothing happened.
If you want to remove all Table Design modifications, switch to the components tab and choose Reset Data Source in the context menu.
I am Tobias, I write this blog since 2014, you can find me on twitter and youtube. If you want you can leave me a paypal coffee donation. You can also contact me directly if you want.
A new feature of Analysis for Office 2.3 is a macro called SAPOpenWorkbook. Some of you maybe know
the old sapbex.xla!SAPBExReadWorkbook or the BExAnalyzer.xla!runWorkbook command.
The user guide explanation for this macro is:
You can use this API method to open an Analysis workbook. The workbook that should be opened can be stored on a SAP NetWeaver server or on a BI platform.
The workbook is opened in the same Microsoft Excel instance. After the command execution, the opened workbook is active.
As you know the sapbex.xla!SAPBExReadWorkbook respectively BExAnalyzer.xla!runWorkbook command needed either an established connection from the addin or you
created your own connection with the following code:
In Analysis for Office the macro SAPOpenWorkbook use the connection of an existing DataSource. So you can’t
define your own connection with a super user or something like that.
The name Demo_5 is the technical name of the workbook from a SAP NetWeaver server. If you want to use a document, which is
stored on a BI Platform, you need the CUID.
The connection parameters will be used from the DataSource DS_1. This parameter is mandatory if you have several connections in a workbook. If you have only one connection, it is
optional. The target workbook will be opened from the referenced connection of DS_1.
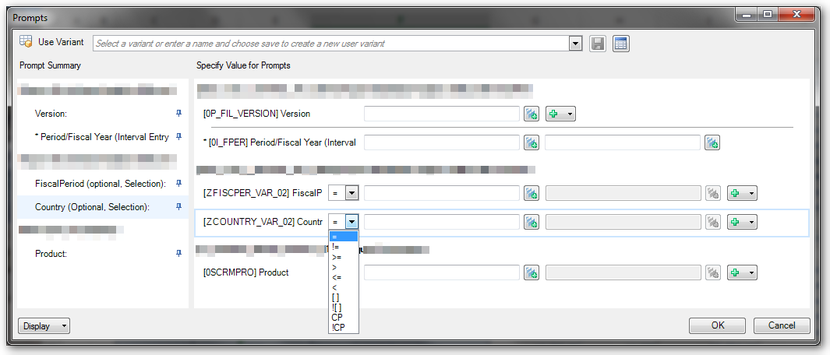
The variable parameter for ZCOUNTRY_VAR_02 is optional, but if you have a mandatory variable you have to assign a value, like the 0I_FPER variable.
If you want to refresh your workbook on opening, you have to set the parameter “Refresh Workbook on Opening”. You also need an established connection or you see the logon popup.
Analysis Office Logon Netweaver
New is the feature that you can predefine your variable value for the new workbook. This is nice but it is still not the same as in BEx Analyzer,
because you have to use the connection from a existing DataSource. I hope SAP will provide us more in the future.
I am Tobias, I write this blog since 2014, you can find me on twitter and youtube. If you want you can leave me a paypal coffee donation. You can also contact me directly if you want.